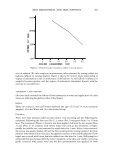
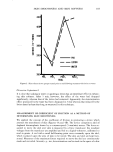
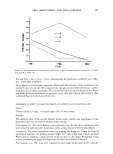
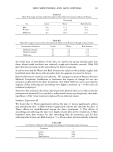
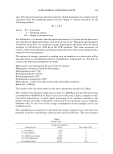
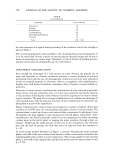
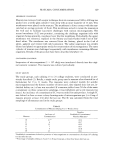
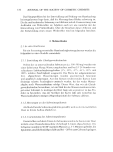
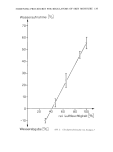
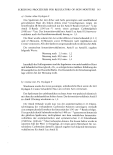
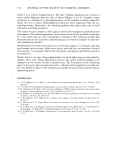
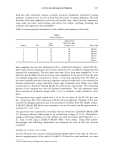
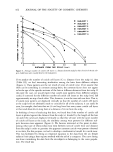
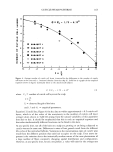
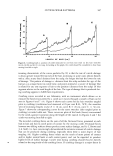
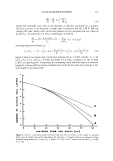
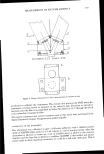
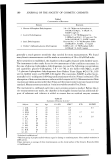
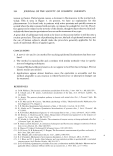
166 JOURNAL OF THE SOCIETY OF COSMETIC CHEMISTS of hair growth k n and k0 were measured, equation [7] would give •w,•, and [8] would then completely define the rate of cuticle wear at any distance from the scalp for that subject. In addition, any of the infinite number of damage rs. x curves generated by this equation for different values of k, and (•w,• will result in a C.W.P. pattern given by [3]. In other words, different rates of hair growth and cuticle wear could still produce C.W.P. similar to the ones observed in our study as long as the cuticle wear rs. x pattern follows, or is very similar to, any of the curves predicted by [8]. Different k. and Cw,• values will have the effect of influencing the development in time of C.W.P., but not its basic shape. In order to observe the form of [8], a set of values can be given to the parameters in {his equation. An accepted average value for k. is • 0.035 cm/day. The order of magnitude of •w,• can be estimated with the data for two shorter hair fe- male subjects, 5 and 6. For Subjects 5 and 6, the tip ends of their hair (assuming that L0 • 30 cm) have lost an average of 6.2 - 0.8 = 5.4 cuticle cell layers (Table II) in t = 30/0.035 days. That is, the average rate of cuticle loss was approximately 0.0063 C.C.L./day. Considering that it is likely that when the hair was much shorter the rate of cuticle damage at the hair ends was less than the average value, it is probable that •w,• is larger than 0.0063 C.C.L./day for the 30-cm-long hairs. Figure 5, curves A, B and C, shows the hypothetical rate of cuticle wear versus x p. attern predicted by [8] for hairs 30, 45 and 60 cm long respectively, k. = 0.03, and Cw,• = 0.008. Curves D, E and F are similar curves calculated using •w,• = 0.006. An in- .009 .008 .007 .006 .005 .004 .003 .002 .ool A B C I I I I I I 10 20 30 40 50 60 DISTANCE FROM THE SCALP (cm.) Figure 5. Rates of cuticle wear vs. distance from the scalp calculated using equation [8] in text. Curves A, B and C were calculated using k n (natural rate of hair growth) = 0.03 cm/day, and Cw,• (rate of cuticle wear at tip end of hair) = 0.008 cuticle cell layers/day. For curves D, E and F, k. = 0.03 cm/day and Cw, • = 0.006 cuticle cell layers/day

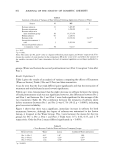
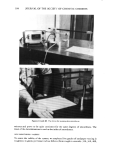
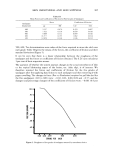
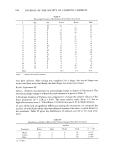
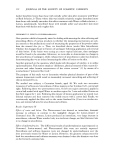
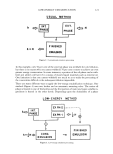
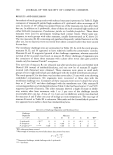
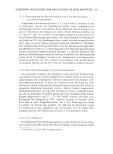
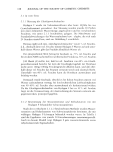
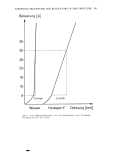
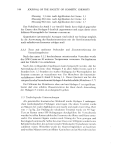
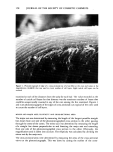
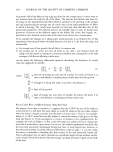
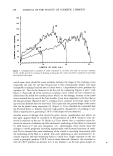
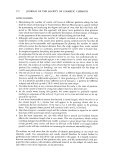
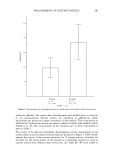
CUTICLE-WEAR PATTERNS 167 4 o 6o 5o 4o 3o 2o lo c A IIIIIIIII o IIIIIIIlil lO LENGTH OF HAIR (cm.) I I I I I I | I ! I | I 20 30 Figure 6. Combing loads vs. position of comb (measured in cm from root end) on dry hair swatches 10.(A), 20.(B) and 30.(C) cm long. In looking at the graph, the comb should be considered to have been moving from left to right teresting characteristic of the curves predicted by [8] is that the rate ot • cuticle damage is always greater toward the tip ends of the hair, increasing in some cases almost linearly with x. Also, at any fixed distance from the scalp, the longer the hair the lower the rate of damage. This pattern of damage rs. distance from the scalp excludes the age of the hairper se as a major factor in cuticle wear, and points instead at a source of damage that is related for any one segment of hair to the position (distance from the scalp) of that segment relative to the total length of the hair. The type of damage that is produced dur- ing combing appears to fulfill these requirements. Combing curves recorded in our laboratory with an instrument which allows us to measure the forces encountered by a comb as it moves through a swatch of hair can be seen in Figures 6 and 7 (19). Figure 6 shows such curves for dry hair swatches tangled prior to combing (conditioned and measured at 65 per cent R.H., 70øF) the swatches were of increasing lengths (curve A = 10 cm, curve B = 20 cm, curve C =- 30 cm). Figure 7 shows the corresponding curves for the same swatches (also tangled prior to combing) recorded while wet. These curves are plots of the loads (forces) encountered by the comb, against its position along the length of the swatch. In Figures 6 and 7 the comb was moving from left to right. The recorded combing forces are the sum of all the frictional forces generated at each hair-to-hair and hair-to-comb point of contact by the moving comb. Frictional forces between two sliding surfaces always produce some surface damage, and A. C. Brown and J. A. Swift (16) have convincingly demonstrated the extensive amount of cuticle damage that can be produced during combing, especially when there is some degree of hair tangling (18). Higher combing forces values are the result of more points of contact and/or higher normal loads at each contact point, and can be expected to produce higher levels of surface damage. Cuticle wear during combing should thus be directly related to the magnitude of the combing forces. If combing damage is a major factor in
Purchased for the exclusive use of nofirst nolast (unknown)
From: SCC Media Library & Resource Center (library.scconline.org)