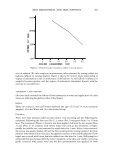
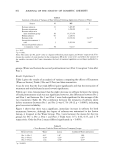
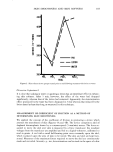
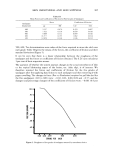
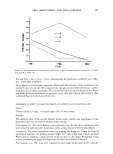
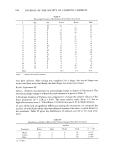
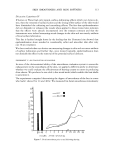
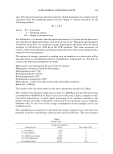
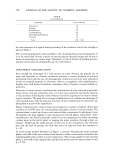
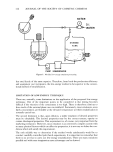
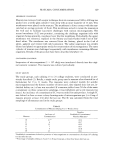
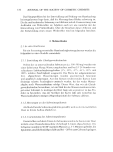
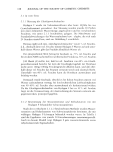
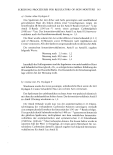
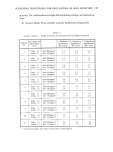
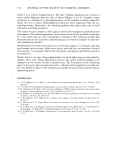
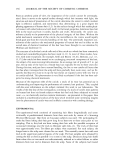
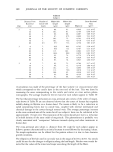
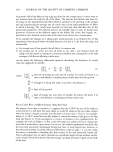
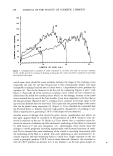
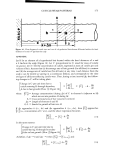
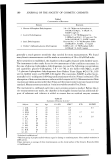
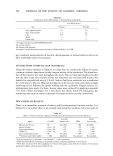
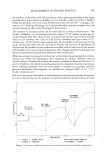
SKIN SMOOTHNESS AND SKIN SOFTNESS 105 Table III Mean Forces and Coefficients of Friction for Five Grades of Sandpaper Sandpaper Force Coefficient of Friction Grains/inch (g) SD C.F. S.D. 600 5.127 0.076 0.470 0.007 500 7.621 0.110 0.699 0.010 400 9.809 0.112 0.899 0.010 360 11.577 0.155 1.062 0.014 320 12.052 0.130 1.106 0.012 500, 600. Ten determinations were taken of the force required to move the sled over each grade. Table III gives the means of the forces, the coefficient of friction and their standard deviations (Figure 5). It can be seen that there is a linear relationship between the roughness of the sandpaper and the forces or coefficients of friction obtained. The S.D.'s are only about 1 per cent of their respective means. The question of whether the system assesses changes in the actual smoothness of skin or the topical lubricating aspect of the lotion, etc. (skin slip), is of interest. We therefore retested the forces and coefficients of friction for the five grades of sandpaper after first applying hand lotion to each sandpaper and then removing it with paper towelling. The changes in force (Pre- to Postlotion) required to pull the sled for the five sandpapers (320 to 600) were: -0.02, 0.01, 0.00, 0.09 and -0.57 and the changes (and percentage changes) of the coefficients of friction were: -0.001 (0.9 per 1.00 90 .80 •L ,50 .40 320 360 400 500 600 GliAINS Pl
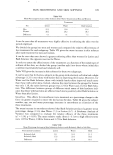
106 JOURNAL OF THE SOCIETY OF COSMETIC CHEMISTS cent), 0.000 (0 per cent), 0.000 (0 per cent), 0.011 (1.3 per cent) and -0.076 (6.9 per cent). Thus it can be seen that the application of lotion had, at most, a miniscule effect on all but the very smoothest of sandpapers. SKIN SMOOTHNESS: EXPERIMENT II Reliability Twenty subjects of both sexes, ranging in age from 24-55, were tested twice for the smoothness of their palms with a 10-min delay between tests. The Pearson Product Moment Correl•ition was 0.947, p 0.0005, indicating extremely high retest reli- ability. Subjects Twenty-seven men and women between the ages of 25 and 54 were randomly divided into three groups of nine each and assigned to a Water, Lotion, or Bath Solution group. Procedure A pretreatment measure was taken before application of Lotion (A), Bath Solution (B), or Water (C). Immediately following the conclusion of the treatment, the first post- treatment measure was taken (Post 1) and, following an additional 10 min, we recorded the second posttreatment measure (Post 2). In all groups, one finger (usually the middle) was treated and the middle phalanx tested. For the Water and Bath Solution Groups, the finger was immersed in tepid so- lutions for 5 min. The Lotion was applied and rubbed over the glabrous skin of the middle phalanx for 1 min and then permitted to remain for an additional 4 min. The excess was then removed with rolling traverses of paper towelling and the visible excesses were removed by gentle rubbing with cotton wool. In all groups, a hair dryer was then employed to blow warm air to dry the skin until it visibly appeared dry. Results.' Experiment II Table IV gives the summary of an analysis of variance for these data. It can be seen that there was a significant effect of trials. The t tests between Pre and Post 1 and between Post 1 and Post 2 were 1.13 and 1.59, indicatingno significant dif- ferences between these conditions overall. However, the result of the t test between Table IV Summary Analysis of Variance for Skin Smoothness Following Treatment with Water, Bath Oil or Lotion Source df MS F Between subjects 26 67.74 Between treatments 2 1 ! 3.18 1.77 Between S's in same treatment group 24 63.96 Within S's 54 10.82 Between trials 2 36.06 3.76* Interaction treatment x trial 4 12.72 1.32 Interaction pooled s's x treatment x trial 48 9.62 *p 0.05. Note: See footnote to Table I for definition of statistical symbols.
Purchased for the exclusive use of nofirst nolast (unknown)
From: SCC Media Library & Resource Center (library.scconline.org)