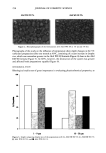
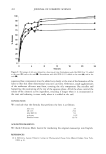
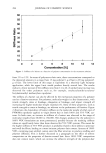
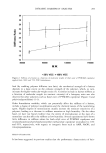
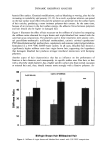
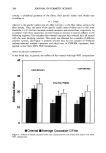
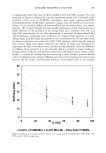
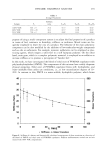
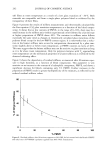
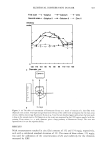
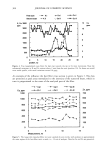
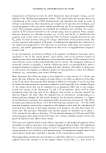
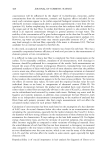
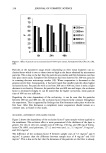
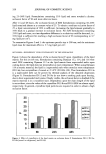
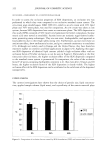
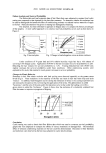
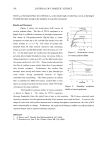
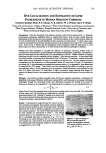
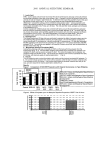
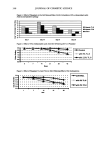
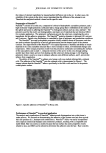
338 JOURNAL OF COSMETIC SCIENCE where Lo is the length of hair tress (160 mm), L• is the initial length of curled hair, and Lt is the length of curled hair after setting in the incubator at a specific time period. Results and Discussion Figure 2 shows the strain-stress (S-S) curves of various polymer films. The film of VP/VA copolymer is so fragile that it is difficult to measure its rheological properties. The stress of Polyquaternium-10 (PQ-10) film is linear proportion to strain up to 2%, and the film breaks when the stress reaches to I x 10 • Pa. The stress of cm'dlan film obtained from sol state linearly increases with increasing strain up to 2%, and the film breaks when the stress is 2 x 10: Pa. On the other hand, the curdlan film that prepared Dom gel state shows higher breakdown stress the stress of film is linear proportion to strain up to 3%, and the film breaks when the stress reaches to 4.4 x 10 v Pa. These results indicate that the film of curdian is more elastic than that of conventional hair fixative polymers. Furthermore, the curdian film becomes more strong and elastic when it goes through gel state before drying presumably because of higher intermolecular crosslinking. The elastic property of curdian film is confirmed by SEM observation curdlan film on hair shows no change even when the hair is bent, while VP/VA film is broken at the same condition. The humidity resistance ability of various polymers is shown in Figure 3. The values for VP/VA copolymer Curdian Gel 4 Cu • , o J 6 9 1 • . 15 Slrcln/O•6 Figure 2. Stress-strain curves for various polymer films. •o too t•o Time/rain Figure 3. Humidity resistance ability of various polymers. decrease drastically •vhen the curled hair is kept in the incubator. PQ-10 shows relatively good humidity resistance, but the application feeling of this polymer was tough and hard. In contrast, the shape of curled hair with curdlan demonstrates no change throughout measurement the value of R % shows substantially no change. Furthermore, the application feeling of curdlan was soft and light as required despite such a superior humidity resistance. References 1. A. Konno and T. Harada FoodHydvocolloids 5, 427 (1991). 2. T. Kawasoe et al. dpn. d. $oc. Uosmet. Ubem., 33, 119 (1999).

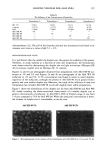
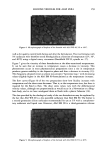
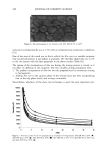
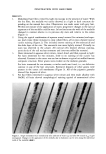
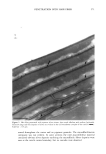
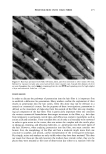
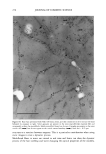
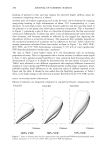
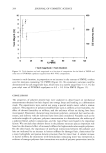
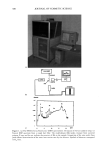
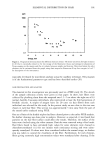
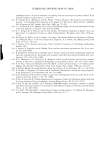
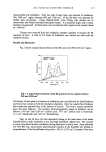
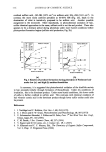
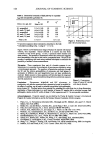
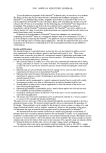
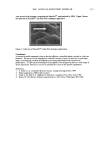
2001 ANNUAL SCIENTIFIC SEMINAR 339 DYE LOCALIZATION AND ESTIMATION OF LIPID PATHLENGTH IN HUMAN STRATUM CORNEUM Gerald B. Kasting', Ph.D., P.S. Talreja', N. K. Kleene:, W. L. Piekens 3 and T. F. Wang • 1 University of Cincinnati, College of qharmacy, 2Dept of Cell Biology, Neurobiology and Anatomy, 3Skin Sciences Institute, Children s Hospital Research Center University of Cincinnati and 4Dept of Chemical Engineering, State University of New York at Buffalo Introduction. Since the elucidation of the biphasic structure of the stratum corneum (SC), i.e., flattened, proteinaceous corneocytes embedded within an ordered !ipid matrix, much has been written about the implications of this structure for solute transport. The barrier properties in skin reside primarily within the SC and are determined by the permeabilities of both corneocyte and !ipid phases. In recent years, many workers have argued that the primary transport pathway for most materials traversing the SC is intercellular [1-4]. If this is true, it follows that the arrangement of the corneocytes within the lipid matrix is a key determinant to the skin's permeability, as it would influence the effective pathlength for diffusion. Methods have been developed to calculate the diffusion of permeants traversing orderly arrays of corneocytes via intercellular [4, 5] and combined interce!!ular/transceilular [6, 7] pathways. Calculations to date have been based on two-dimensional (2-D) representations of the SC. Modern confocal microscopy techniques provide a tool for evaluating one key property - !ipid pathway tortuosity - in more detail than previously possible, by allowing direct observation of the 3-D structure. Furthermore, confocal techniques enable improved dye localization in tissue, by eliminating out-of-focus flare. We have studied corneocyte arrangement and dye localization in alkali-expanded human SC using both 2-D and 3-D fluorescence microscopy [g]. Lipid pathlengths and geometrical tortuosity factors, x•, in expanded SC were determined by analysis of the 2-D images. These values were then corrected for the effects of swelling to arrive at corresponding values x z for the membrane prior to expansion. Model calculations were conducted to !ink these 2-D values with actual 3-D tortuosities. Finally, microscopic images obtained from human SC stained with dansyl chloride, then expanded, were analyzed to determine the location of the dye within the tissue. Methods. Cross-sections of alkali-expanded human SC [9] were optically examined by a combination of brightfield microscopy, differential interference contrast (DIC), and fluorescence microscopy techniques. Pathlengths through the intercellular lipiris were determined manually and divided by the local SC thickness to estimate x• for expanded SC. The tortuosity prior to expansion, x v was calculated fi'om Eq. I: oe, rg -1 = T,(% -l) (1) where Et and Et were the estimated lateral and transverse swelling ratios in the tissue [g]. The relationship of these values with 3-D tortuosities was established by methods described elsewhere [10]. Selected SC samples were stained with Nile red and examined in three dimensions using a laser scanning confocal microscope, using excitation at 488 rim. Results. A representative image of human SC is shown in Fig. 1. The corneocyte arrangement shows partial columnar alignment, but less than that assumed in some "brick-and-mortar" structural models for the SC [4, 5]. Similar arrangements were seen for the other samples analyzed. The results of !ipid pathlength analyses for these samples are summarized in Table I. The average tortuosity factor in the expanded state was x• = 3.7 _+ 0.7. This led to a calculated value prior to expansion of x z = 12.7 _+ 2.3. According to our current estimates, this 2-D value for tortuosity will translate into a value of about 10 in three dimensions (Fig. 2). Two-dimensional brick-and-mortar models [4, 5] yield values for x z ranging fi'om 5.8 to 22.5 [8]. ..... Figure 1. Light mi•o•aph of aikali-expan&d human SC stained wi• methy!•e chloride. •is •mple yielded a value of 3.3 for z• and 13.2 for
Purchased for the exclusive use of nofirst nolast (unknown)
From: SCC Media Library & Resource Center (library.scconline.org)