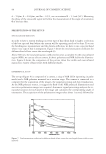
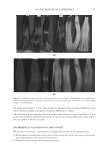
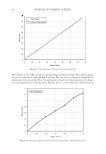
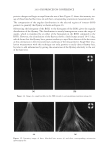
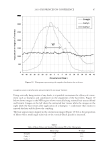
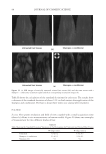
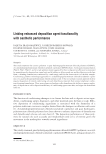
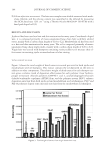
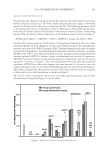
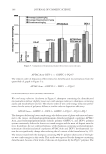
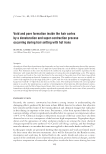
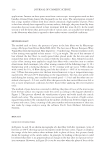
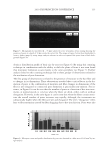
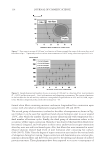
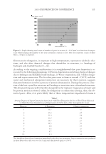
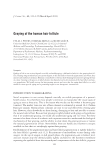
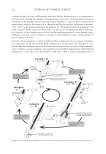
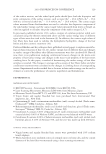
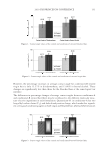
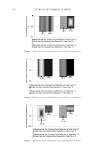
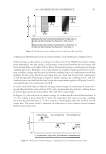
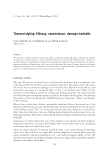
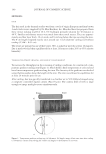
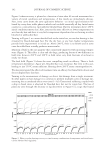
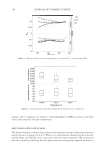
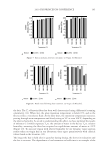
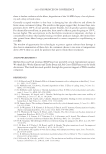
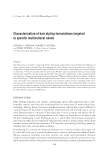
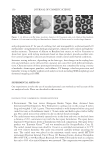
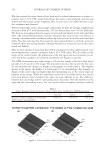
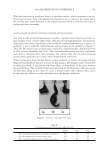
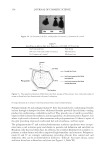
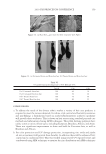
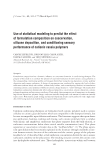
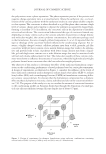
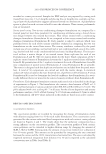
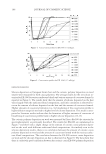
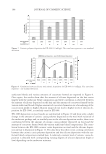
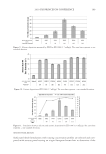
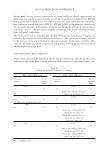
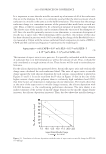
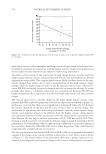
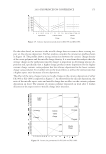
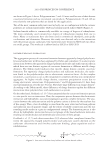
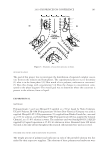
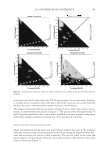
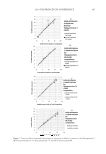
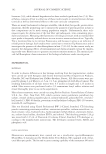
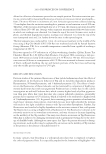
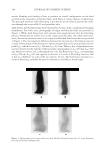
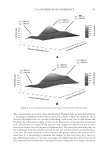
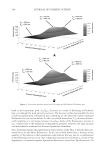
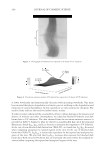
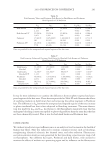
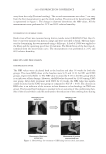
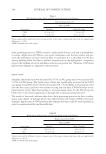
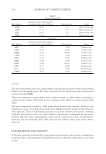
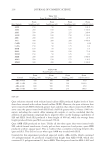
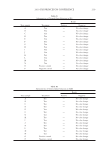
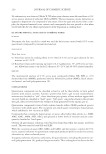
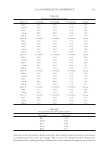
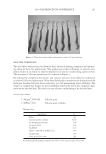
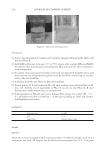
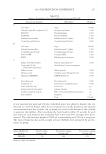
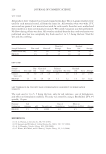
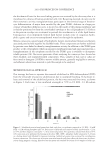
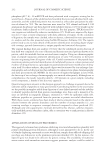
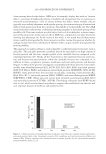
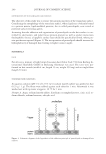
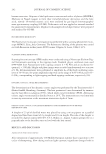
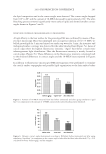
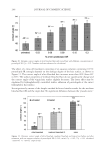
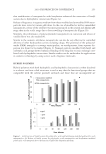
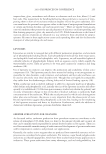
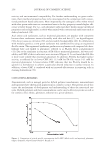
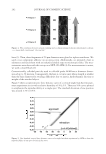
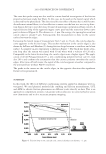
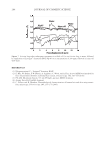
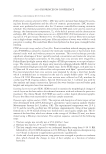
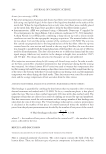
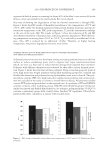
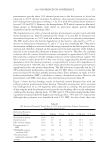
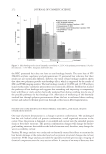
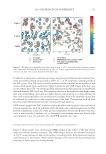
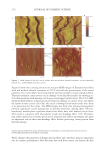
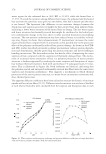
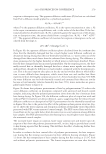
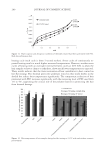
2010 TRI/PRINCETON CONFERENCE 185 Figure 5. Contour phase diagrams. The lines represent dilution lines and the points represent the dilutions prepared. coacervate could not be detected by the UV-Vis spectrometer. It was important, therefore, to visually observe each plate and to identify in which the coacervate was unobservable by the detector, and to eliminate these samples from our overall analysis. The images of the serial dilutions are shown in Figure 6 are in order of decreasing concen- tration, as represented by the points in Figure 5. The opacity of the Polyquaternium-76 and Polyquaternium-88 are due to the relative insolubility of some polymer components within these samples, and not necessarily due to the presence of coacervate. PERCENT SOLIDS IN FOAM AND LIQUID PHASE Solids concentrations for the foam and liquid phases formed, for each of the polymer/ surfactant solutions, were determined gravimetrically by drying the liquid and foam frac- tions and measuring the percent solids remaining. The percent solids in the foam and liquid appear to be statistically identical, decreasing linearly as the percent of the stock solutions decreases (Figure 7).

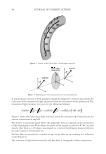
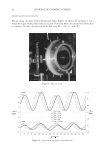
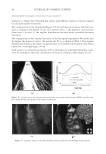
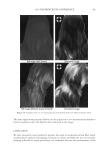
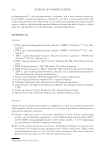
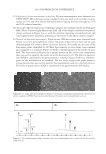
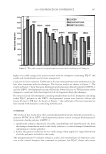
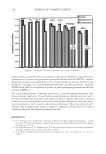
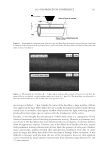
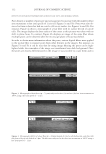
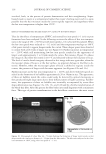
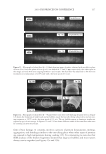
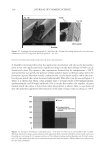
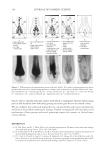
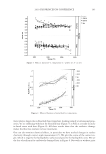
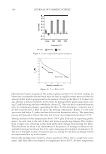
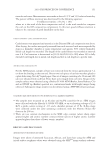
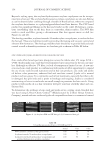
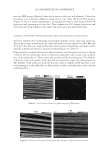
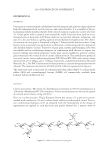
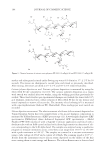
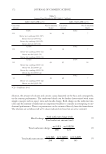
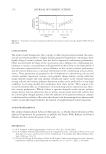
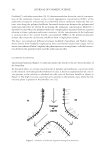
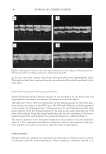
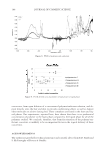
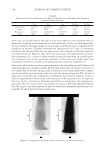
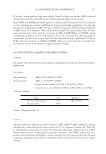
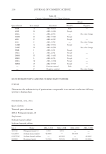
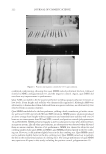
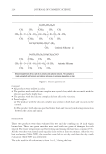
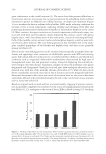
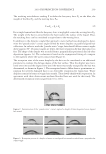
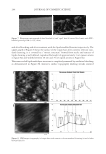
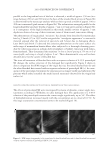
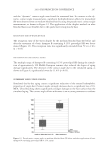
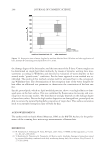
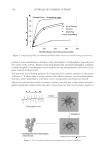
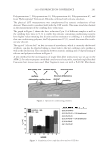
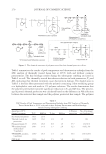
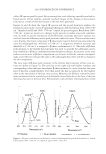
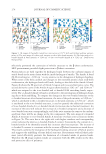
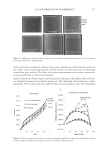
JOURNAL OF COSMETIC SCIENCE 186 Figure 6. Photographs of solution with visible liquid and foam layers after shaking. (A) Polyquaternium-7. (B) Polyquaterium-10. (C) Polyquaternium-76. (D) Polyquaternium-88. In all cases, the solids content of the foam and liquid phase were approximately equal. This indicates that there is not preferential concentration of the solids ingredients by the foam phase. POWDER FT-IR ANALYSIS OF FOAM AND LIQUID PHASES Fourier-Transform Infrared Analysis (Figure 8) was performed on the dried foam and liquid phases to determine the amounts of polymer in each of the phases. The peak from 3700 to 3000 was determined to be the identifying peak for each of the poly- mers, because of its absence in the SLE2S trace. The N-H and O-H peaks are both represented in this region. For Polyquaternium-7, Polyquaternium-76, and Polyquaternium-88, these peaks represent N-H. For Polyquaternium-10, the peak in this region represents the O-H peaks of the polymer. Using the integral under this peak, the ratio of polymer in the foam to polymer liquid of the same dilutions was calculated and plotted, as shown in Figure 9. The ratios of (polymer in the foam phase):(polymer in liquid phase) clustered around the value of 1. This experiment provided no evidence for selective fractionation of the poly- mers and their associated coacervates in either the foam of liquid phases. CONCLUSIONS Polymer/surfactant complexes are important for deposition of materials such as silicone via shampoo and body wash formulations. These complexes, commonly referred to as
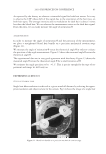
Purchased for the exclusive use of nofirst nolast (unknown)
From: SCC Media Library & Resource Center (library.scconline.org)