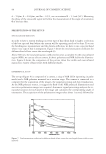
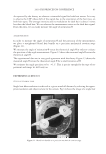
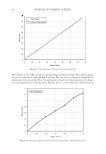
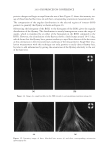
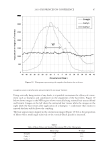
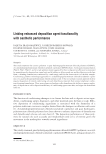
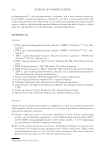
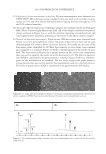
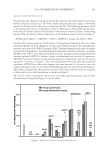
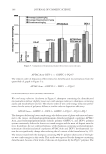
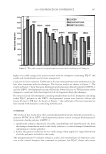
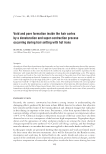
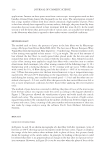
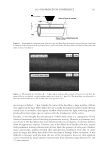
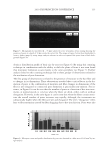
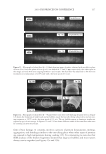
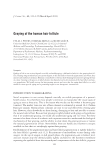
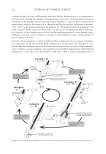
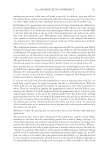
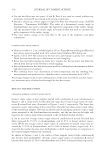
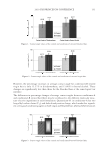
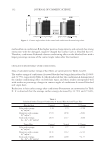
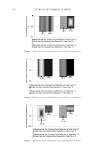
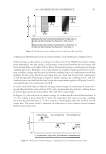
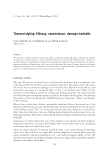
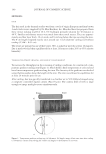
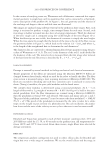
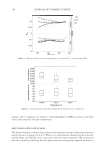
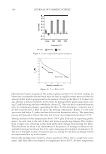
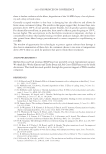
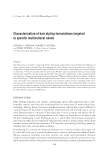
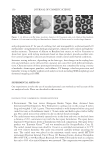
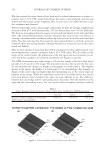
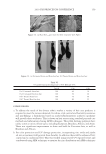
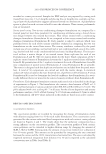
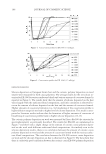
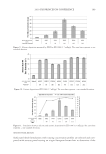
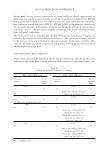
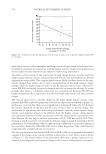
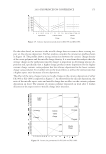
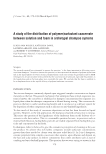
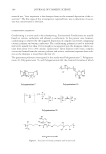
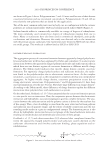
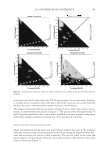
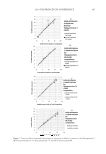
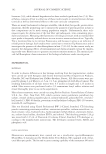
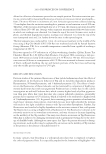
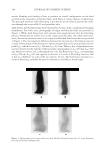
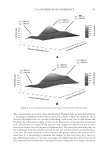
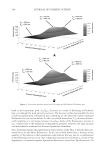
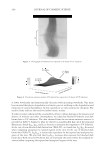
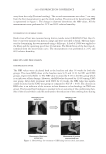
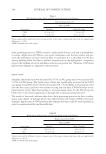
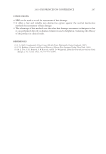
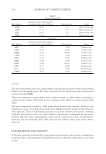
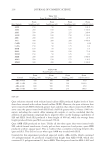
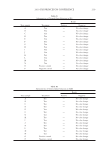
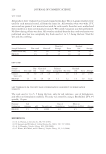
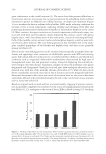
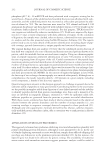
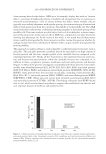
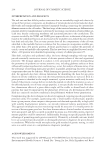
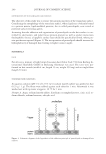
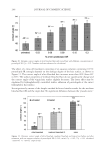
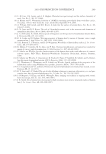
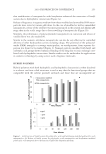
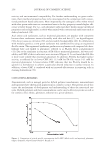
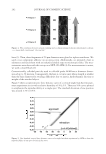
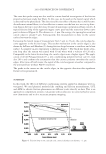
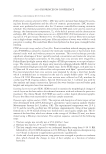
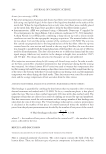
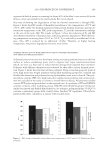
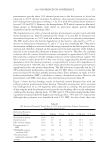
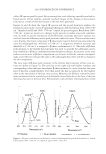
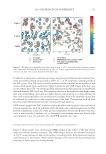
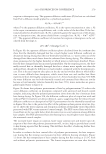
2010 TRI/PRINCETON CONFERENCE 169 SENSORY PANEL RESULTS Surfactant blend formulations with varying coacervation profi les are selected and com- pared with sensory panel testing on virgin European brown hair to determine if the Figure 9. Silicone deposition measured by XRF for EX-1086 (1.7 mEq/g). The error bars represent ± one standard devation. Figure 10. Cationic deposition of EX-1086 (1.7 mEq/g). The error bars represent ± one standard deviation. Figure 11. Correlation between silicone and cationic deposition for EX-1086 (1.7 mEq/g). The error bars represent ± one standard deviation.

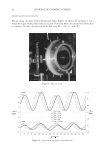
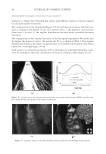
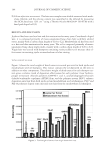
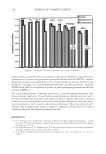
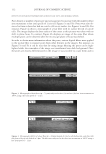
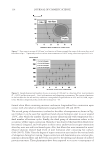
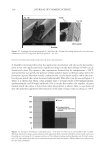
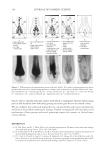
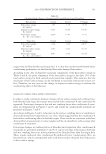
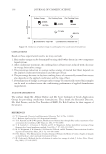
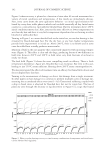
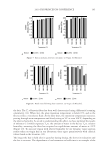
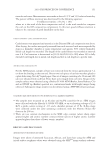
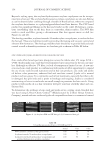
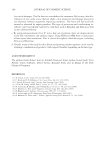
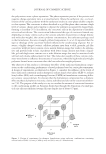
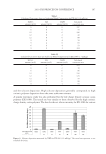
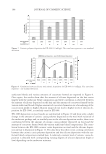
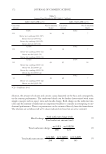
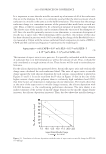
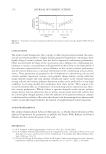
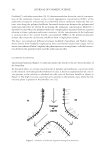
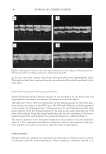
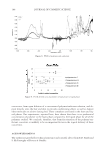
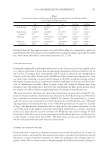
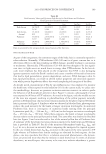
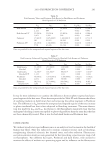
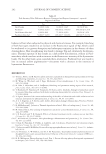
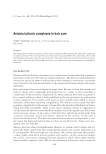
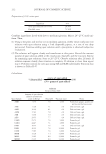
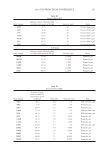
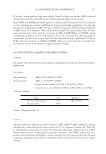
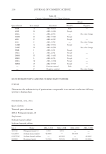
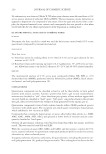
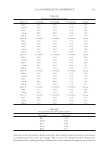
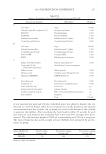
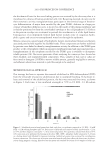
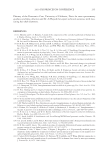
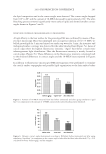
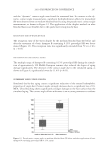
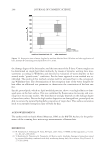
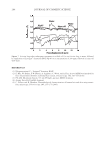
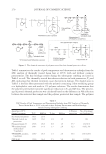
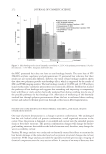
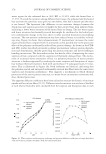
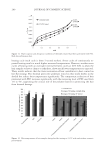
JOURNAL OF COSMETIC SCIENCE 170 coacervate profi le infl uences the sensory performance on hair. Several shampoo formulation from the design reported in Figure 1 are compared for sensory performance. The shampoo formulation also contains 0.25 wt% cationic cassia polymer (EX-906 or EX-1086), 2 wt% of a small particle size dimethicone silicone emulsion (Dow Corning® 2-1352 sili- cone emulsion (0.5 μm average particle size)), and 1 wt% NaCl it is adjusted to pH of 7. An example of shampoo formulations used in a sensory panel test is shown in Table III. As previously described, several criteria were compared as a forced choice between hair tress pairs. The sensory panel tests results are analyzed for statistical signifi cance using an exact binomial test, and only the results at 95% and 99% confi dence levels are reported. An ex- ample of the statistical analysis results from the comparison of formulation A to formulation B from Table III is reported in Figure 12. Statistically superior wet combing (at more than 99% confi dence level), wet feel (at more than 99% confi dence level), dry combing (at more than 99% confi dence level), and dry feel (at more than 95% confi dence level) are achieved with formulation B. No statistically signifi cant difference in static buildup is observed be- tween the two formulations. These results also show that although both formulations show relatively similar coacervation profi les (similar coacervate amount as reported in Table I), they demonstrate a signifi cant conditioning performance difference. Table III Formulation A and B Composition Used for a Sensory Panel Test (all wt% active) Formulation A Formulation B SLES-3 6 9 SLS 8 4 CAPB 6 4 Silicone emulsion, Dow Corning® 2-1352 (0.5 μm) 2 2 Cationic cassia polymer EX-906 0.25 0.25 NaCl 1 1 Figure 12. Statistical analysis of sensory panel testing.
Purchased for the exclusive use of nofirst nolast (unknown)
From: SCC Media Library & Resource Center (library.scconline.org)