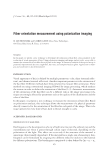
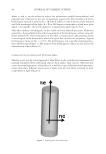
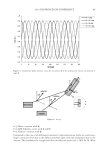
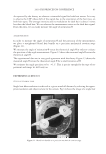
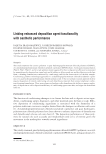
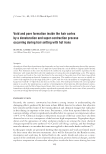
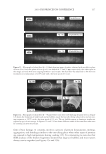
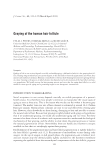
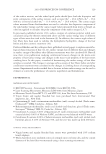
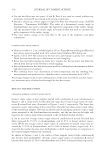
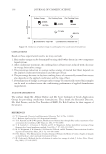
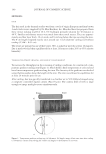
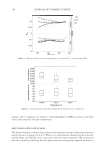
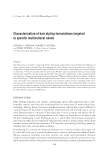
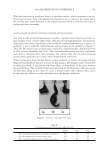
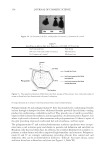
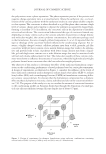
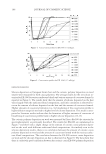
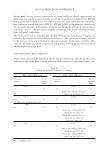
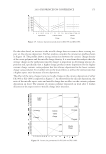
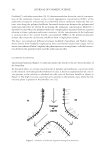
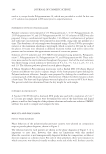
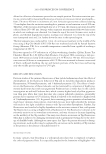
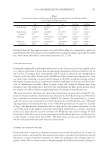
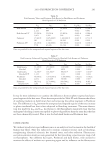
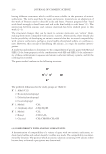
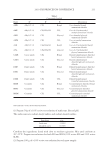
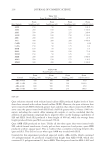
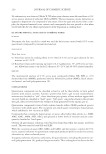
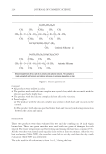
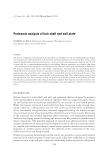
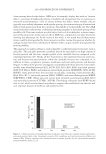
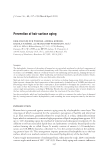
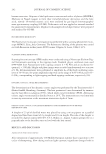
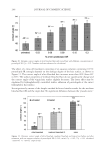
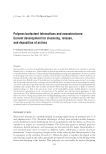
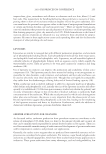
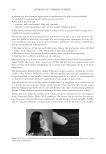
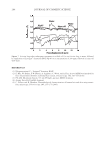
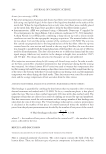
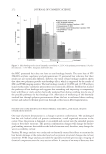
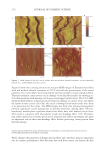
2010 TRI/PRINCETON CONFERENCE 183 Figure 4. Schematic of coacervate presence in foam. RESEARCH GOALS The goal of this project was to investigate the distribution of separated complex coacer- vate between the solution and foam phases. The experimental plan set out to determine (1) what is in the foam phase? (2) How much of it is polymer, surfactant or coacervate? (3) Does this change with concentration? (4) Does the change in concentration corre- spond to the phase diagram? The overall goal was to determine where the coacervate is present in the solution, foam or liquid. EXPERIMENTAL MATERIALS Polyquaternium-7 used was Merquat® S supplied as a 9%wt liquid by Nalco Company. UCare® Polymer JR-30M (Polyquaternium-10) from Dow Chemical Company was used as supplied. Mirapol® AT-1 (Polyquaternium-76), supplied from Rhodia Canada Inc., was used as a 10% wt solution, and Cola® Quat PDQ (Polyquaternium-88) was supplied by Colonial Chemical, as a 35.8% solution in water. The surfactant used was Standapol® ES-2 (SLE2S) supplied by Cognis Corporation as 35.8% wt solution in water. Deionized water (DI water) was used as the only solvent throughout this research. All materials were used as received. POLYMER SOLUTIONS AND SURFACTANT SOLUTIONS The weight percent of polymer and surfactant in each of the provided solution was fur- nished by their respective suppliers. The solutions of these polymers and surfactant were

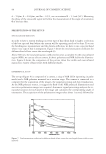
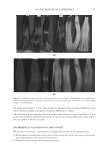
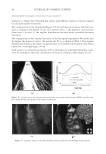
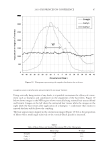
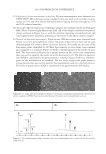
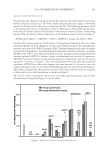
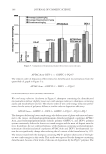
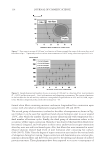
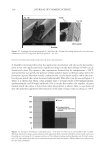
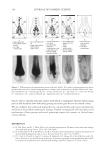
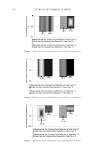
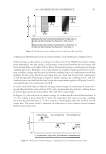
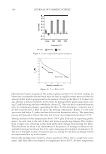
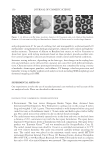
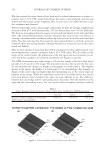
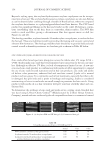
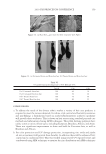
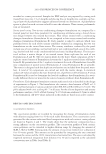
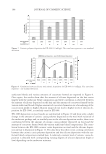
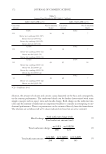
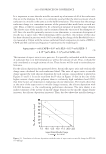
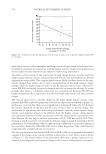
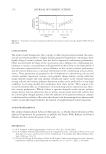
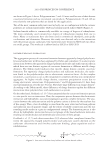
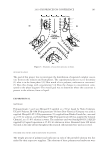
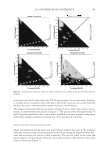
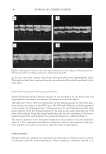
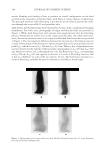
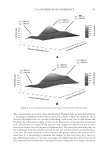
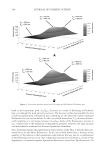
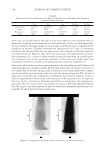
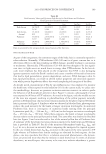
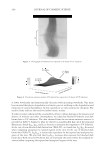
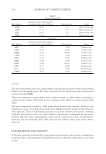
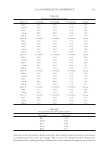
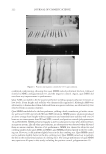
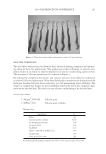
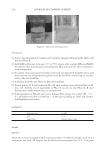
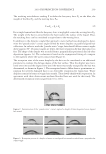
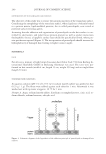
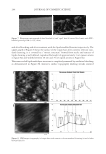
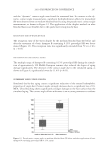
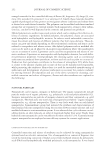
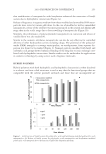
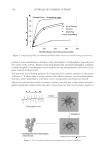
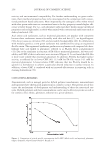
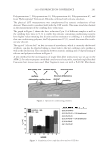
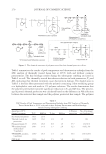
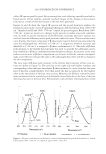
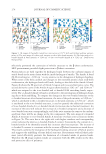
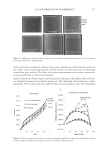
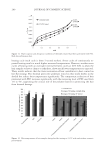
JOURNAL OF COSMETIC SCIENCE 184 used as is, except for the Polyquaternium-10, which was provided as a solid. In this case a 1% solution was prepared in DI water prior to experimentation. PREPARATION OF PSEUDO-PHASE DIAGRAMS Polymer solutions were prepared of 2% Polyquaternium-7, 0.5% Polyquaternium-10, 2% Polyquaternium-76, and 2% Polyquaternium-88. A 15% solution of SLE2S was also prepared. Using a combinatorial liquid handler, 136 different combinations of polymer and surfactant concentrations were prepared in microwells, using only one polymer at a time. The absorbance of each sample was determined using a Tecan UV-Vis spectropho- tometer at the maximum absorbance wavelength, which occurred at 600 nm for each of the plates. 10 scans were obtained at different locations within each well to detect the presence and to estimate the approximate amount of coacervate present. Solutions of 0.5% polymer and 15% SLE2S were prepared using polymers, Polyquater- nium-7, Polyquaternium-10, Polyquaternium-76, and Polyquaternium-88. These solu- tions were used as the stock solutions throughout this project. Each of the stock solutions was diluted using a stock solution to water ratio of 9:1, 4:1, 7:3, 3:2, 1:1, 2:3, 3:7, 1:4, and 1:9. The dilution path was plotted on each phases diagram. A Nikon Optiphot2-Pol polarizing microscope with a Kodak DSC 290 Zoom Digital Camera attachment was used to capture images of the foam prepared upon shaking the Polymer/surfactant dilutions. Samples were prepared by shaking the scintillation vials containing each of the dilutions using a Vortex Genie 2 Shaker for three minutes to form a foam layer. The foam and liquid phases were each placed in an oven at 80°C for 4 hours. The percent solids was determined from the dry weight for each sample. POWDER FT-IR SPECTROSCOPY A Nicolet 6700 FT-IR with a diamond ATR probe was used with a resolution of 2 cm-1 at 32 scans per sample. Spectra were determined for each of the dried foam and liquid phases, as well as dried samples of the polymer solutions and surfactant solution. OMNIC software was used to compile and compare the data. RESULTS AND DISCUSSION PSEUDO–PHASE DIAGRAMS Phase behaviors of the polymer/surfactant/water systems were plotted on composition maps as pseudo-phase diagrams, shown in Figure 5. The dilution lines for each poymer are shown in the phase diagrams of Figure 5. It is important to note here, however, that there are limitations with this method when the coacervate is not homogeneously dispersed within the composition, or when it does not separate as a distinct layer. For each of these polymers, there were instances in which coacervate was observed visually to adhere to the side of the well. In these cases the
Purchased for the exclusive use of nofirst nolast (unknown)
From: SCC Media Library & Resource Center (library.scconline.org)