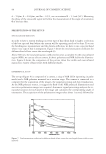
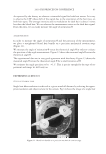
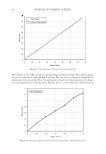
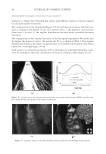
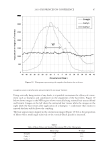
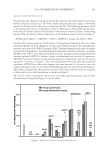
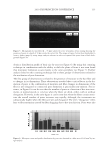
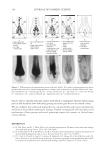
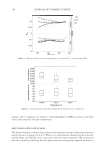
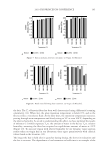
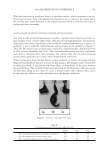
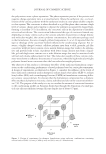
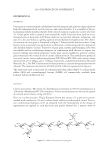
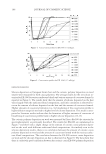
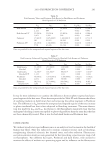
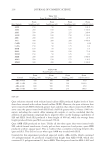
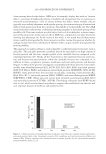
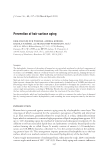
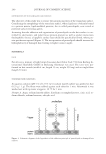
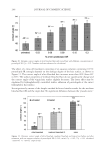
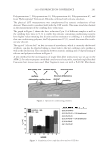
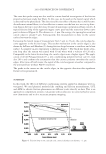
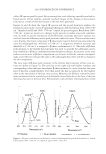
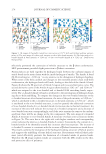
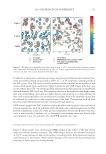
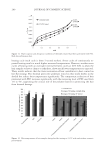
2010 TRI/PRINCETON CONFERENCE 151 times for each tress. Measurements were made at about 22.5°C and 55% relative humidity. The percent stiffness retention was determined by the following equation: % stiffness retention = (w5/wi) × 100, where wi is the work of the fi rst compression and w5 is the work needed to compress the curl on the fi fth consecutive compression. In this test, good stiffness retention is taken to be a measure of good durability on the hair. HIGH-HUMIDITY CURL RETENTION TEST Curled tresses were prepared and treated as in the DiastronTM curl compression test above. After drying, the curlers were gently removed from each tress and curls were suspended by clips in a humidity chamber at room temperature and approx. 90% relative humidity. Initial curl length was recorded. The length of the curled tresses was recorded at intervals over 4 h. Curl retention is determined as [(L (0)-L(t))/L(0)-L(i))×100] where L(0) is fully extended curl length, L(i) is initial curl length and L(t) is curl length at a specifi c time. ATOMIC FORCE MICROSCOPY For the AFM analysis, samples of hair were removed from the tresses approximately 3-4 cm from the binding at the root end. One to two inch pieces of cut hair was then glued to a glass slide using "fast dry" liquid paper. One set of images consisting of a 20 um and 100 um were obtained from each hair. Three hairs were imaged from each tress. Images of the sample surfaces were obtained using a Bruker D 5000 AFM (Bruker, Santa Barbara, CA) and an OTESP tip (Bruker) operated in a conventional mode with height images being collected. Subsequent image analysis was determined using a SPIPTM software package. SCANNING ELECTRON MICROSCOPY: MORPHOLOGY & ELEMENT MAPPING The samples were mounted on an Al plate and Au/Pd coated for 60 sec. SEM images • were collected with the Hitachi S-3400N VP-SEM, at an accelerating voltage of 15.0 KeV, a probe current setting of ∼65, and a chamber pressure of 15 Pa. X-Ray maps were collected under the same operating conditions with the Thermo Noran SD detector for 200 sec. There are two contrast mechanisms in the SEM: edge contrast (where sharp edges • appear bright) and atomic number contrast (where species of higher atomic number appear brighter than those of lower atomic number). RESULTS AND DISCUSSION AFM RESULTS FOR ENHANCED SHINE Images were taken of untreated Caucasian, African, and Latin hair using the AFM and initial surface roughness values were obtained using the SPIPTM image analysis software.

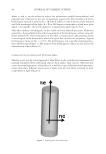
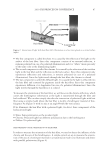
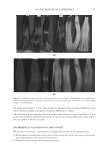
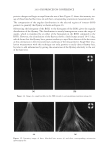
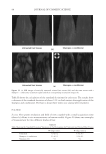
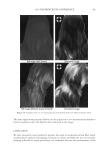
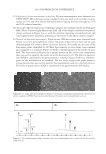
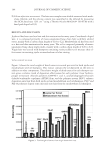
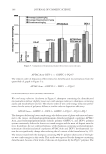
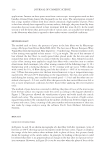
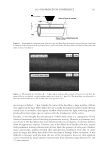
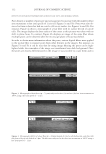
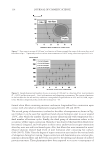
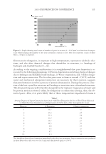
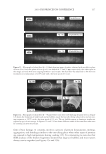
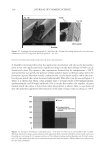
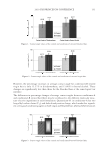
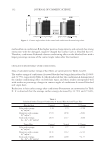
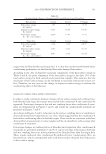
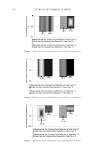
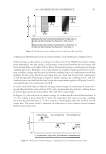
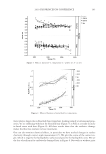
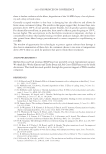
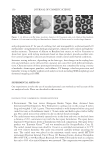
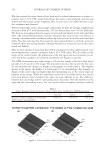
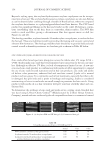
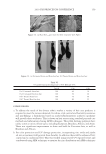
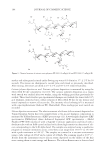
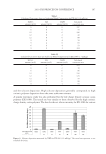
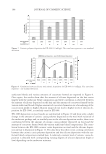
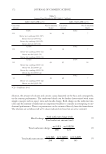
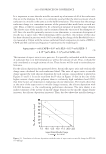
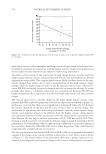
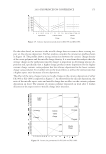
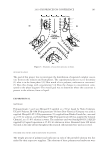
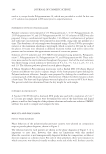
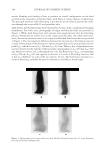
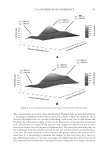
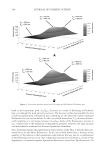
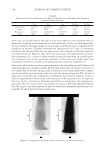
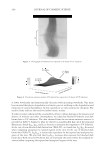
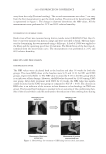
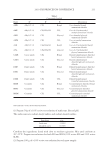
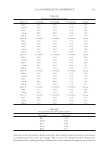
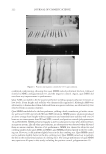
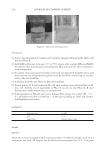
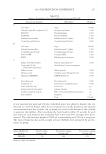
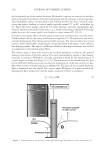
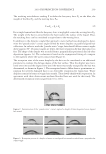
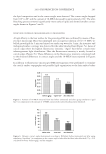
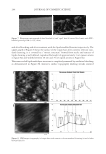
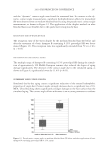
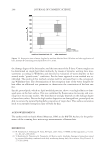
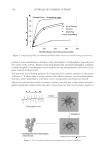
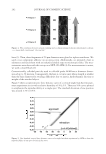
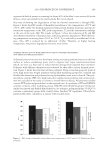
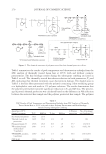
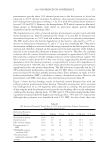
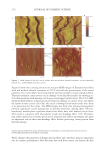
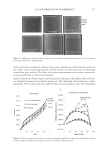
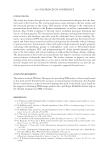
JOURNAL OF COSMETIC SCIENCE 152 We then treated the same identical hair shaft with acrylates/hydroxyesters acrylates co- polymer from a 55% VOC pump formulation hair spray, and reanalyzed each hair and determined the average surface roughness (Ra). In each case a noticeable decrease in sur- face roughness was obtained. We have found that across a broad range of hair types we have the average roughness has decreased from 87% for Caucasian hair, 35% for African hair, and 31% for Latin hair. The decrease in roughness directly equates to increased smoothness on the individual hair shaft. The acrylates/hydroxyesters acrylates copolymer hair fi xatives are very effective at creating a smoother surface and hence enhancing shine on a micro level on individual hair shafts. The data indicates that Caucasian hair types responded best to alcoholic sprays for enhanced shine and styling benefi ts, although benefi ts are achieved across all hair types tested (see Table I). Here we have images of Caucasian hair before treatment and after application of acry- lates/hydroxyesters acrylates copolymer from a 55% VOC spray. We can clearly see the ridges of the cuticles before the application of the hair spray and after treatment we ob- serve much less roughness, or increased smoothness (see Figures 2a and 2b). The AFM measurement was taken along a 100-micron length of the hair shaft which provides 10-20 cuticles in the image. The instrument moves a fi ne tip over the hair cuti- cle and measures the changes in height or topography or overall surface. The brighter feature in the image, the higher it is with respect to its surroundings. For example, in Figure 2a the cuticle edges are higher than the surrounding area, so the cuticle edges are brighter in the image. When the individual cuticles have been fl attened or the cuticles have been fi lled in after treatment the edges are more diffi cult to see. The difference between the cuticle edge and the surrounding area is much less. Now the difference in the edge and the surrounding area is less, the overall surface roughness has been reduced. Table I Surface Roughness Reduction Across a Variety of Hair Types, Confi rmed by AFM Measurements Caucasian African Latin Decrease in surface roughness as measured by AFM (average 3 measurements) 87% ± 9.3 35% ± 5.9 31% ± 5.6 Figure 2. (a) Pre-treated hair shaft. (b) Post-treated hair shaft.
Purchased for the exclusive use of nofirst nolast (unknown)
From: SCC Media Library & Resource Center (library.scconline.org)