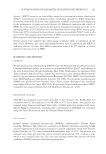
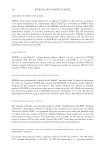
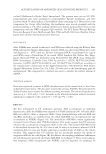
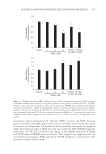
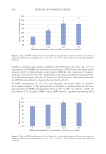
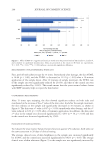
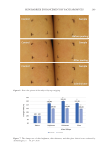
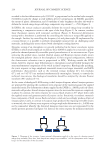
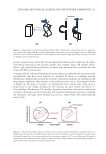
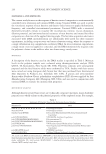
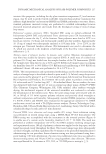
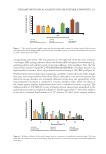
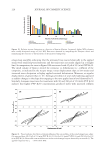
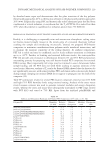
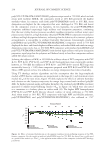
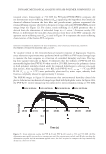
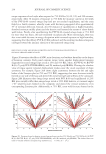
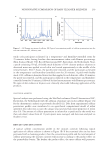
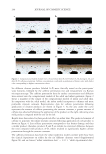
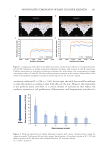
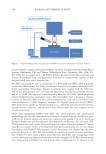
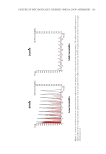
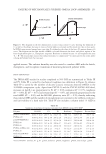
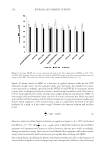
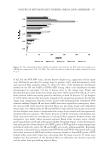
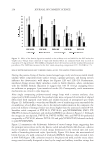
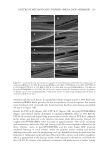
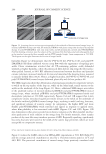
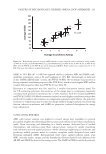
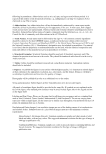
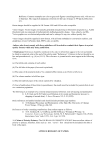
223 DYNAMIC MECHANICAL ANALYSIS OF HAIR-POLYMER COMPOSITES corresponding seam welds. The four polymers on the right half of the bar chart in Figure 7 are higher MW styling polymers, where the absolute MW and physical networking (e.g., polymer-polymer and polymer-cuticle attractions) influence style toughness. Note that the elasto-brittle response of poly(VCL/VP/DMAPMA/MAPLDMAC) was likely related to its high humidity resistance, where the polymer is hard and strong at 50% RH (see Figure 8). Freshly prepared tresses shaped into omega loop assemblies contain the same width, length, hair type, and average number of hair fibers. Hence, although it is not trivial to dynamically define the storage modulus of a torsionally deformed omega loop, the repeatability of the loop preparation facilitates a comparative torsional modulus index, where the slopes of the torque against angular displacement were used to estimate the elastic response. The stiffness results at 50% RH for a series of fixative-treated omega loops normalized to the untreated tress results are displayed in Figure 8. Trends suggest that ca. 40% of the stiffness is lost after a torsional displacement of ± 23°, whereas 50–60% of the original stiffness 0 5 10 15 20 25 30 35 40 45 180 Volume of 1% (w/w) solug415on (μL) PVP K-90 PVP K-60 PVP K-30 Branched PVP PVP K-15 p(VP/DMAPMA) p(VCL/VP/DMAPMA/MAPLDMAC) p(VP/DMAPMA/MAPLDMAC) p(VP/LM/AA) Figure 7. The critical torsional angle represents the twisting angle required to induce fixative film fracture (see Figures 6D and E). Higher MW (pseudo)cationic treatments appear to increase the deformation required to induce film failure (50% RH). 0 1 2 3 4 5 6 7 8 9 4 23 45 Torsional Twist (°) PVP K-90 PVP K-60 PVP K-30 Branched PVP PVP K-15 p(VP/DMAPMA) p(VCL/VP/DMAPMA/MAPLDMAC) p(VP/DMAPMA/MAPLDMAC) p(VP/LM/AA) Figure 8. Relative stiffness of the styled omega loop as a function of cumulative torsional angle. The data show that the stiffness of each treated omega loop decreased as a function of increased torsional deformation (50% RH). Crig415cal Torsional Angle (°) Relative Stiffness(AU)

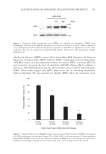
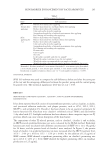
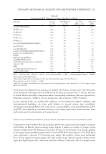
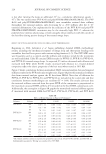
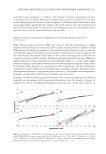
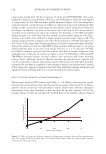
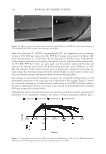
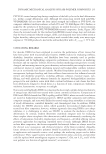
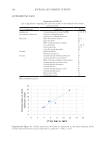
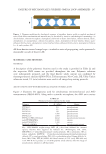
224 JOURNAL OF COSMETIC SCIENCE is lost after twisting the loops an additional 22° (i.e., cumulative deformation equals ± 45°). The two outliers were PVP K-60 and poly(VP/DMAPMA/MAPLDMAC). The PVP K-60 and poly(VP/DMAPMA/MAPLDMAC) tress assemblies retained their stiffness throughout the torsional analysis, only decreasing by ca. 20% stiffness after the ± 45° torsional deformation. One explanation for the resilience of the PVP K-60 and poly(VP/ DMAPMA/MAPLDMAC) treatments may be the mutually high PDI 7, wherein the polymers have intrinsic plasticizing, or form uniquely robust interfaces with the cuticles of the hair fiber during passive drying of the treated omega loops. EFFECT OF STYLING-RESIN DILUTION ON OMEGA LOOP PERFORMANCE Beginning in 1996, Jachowicz et al. began publishing detailed DHSA methodology results, including the mechanical response of omega loop and three-point bending tress assemblies that had been preset with various styling fixatives (1–5). The PVP MW series was frequently used as a control, and the stiffness and resilience trends for the treatments are well established. Table III contains DHSA results for PVP K-15, PVP K-30, PVP K-60, and PVP K-90–treated omega loops. As expected, F1 indices decreased with dilution and increased with MW, while E10/E1 results increased with dilution (i.e., fixative-diluted composites reflect the elastic properties of the hair tress) when tested at 50% RH. Figure 9 shows correlations between normalized SAOS torsional analysis data and uniaxial stiffness results for the PVP molecular weight series. Figure 9A plots the normalized stiffness data from torsional analysis against the F1 data from DHSA. Note that all dilutions for PVP K-15, PVP K-30, PVP K-60, and PVP K-90 are included in the scatter plot and that correlations between methodologies are excellent (R2 = 0.94). The results advocate that the torsional stiffness extracted from the quasi-LVER of the composites is proportional to the maximum uniaxial DHSA stiffness (F1) recorded in the first DHSA compression cycle. Additionally, the scatterplot in Figure 9B graphs the normalized torsional stiffness against E’ measured with uniaxial DMA for PVP K-15, PVP K-30, PVP K-60, and PVP K-90 Table III Effect of Resin Dilution on Fixative Perfomancea. Polymer Volume F1 F10/F1 E10/E1 H10/H1 PVP K-15 180 109 ± 11 0.89 ± 0.02 0.21 ± 0.03 0.94 ± 0.03 90 102 ± 09 0.90 ± 0.02 0.37 ± 0.07 0.94 ± 0.07 45 78 ± 10 0.91 ± 0.01 0.41 ± 0.07 0.97 ± 0.05 PVP K-30 180 148 ± 10 0.87 ± 0.03 0.31 ± 0.08 0.94 ± 0.02 90 112 ± 08 0.87 ± 0.02 0.46 ± 0.05 0.94 ± 0.05 45 104 ± 14 0.88 ± 0.01 0.49 ± 0.04 0.96 ± 0.04 PVP K-60 180 195 ± 08 0.82 ± 0.02 0.30 ± 0.03 0.92 ± 0.02 90 174 ± 11 0.85 ± 0.01 0.37 ± 0.11 0.93 ± 0.12 45 130 ± 07 0.84 ± 0.04 0.43 ± 0.08 0.94 ± 0.07 PVP K-90 180 217 ± 13 0.83 ± 0.01 0.30 ± 0.05 0.91 ± 0.03 90 179 ± 05 0.85 ± 0.02 0.34 ± 0.07 0.93 ± 0.04 45 150 ± 14 0.84 ± 0.04 0.47 ± 0.05 0.94 ± 0.11 a The volume and force units are reported in μl and G, respectively, while F10/F1, E10/E1, and H10/H1 are dimensionless quantities. Testing was conducted at 50% RH.
Purchased for the exclusive use of nofirst nolast (unknown)
From: SCC Media Library & Resource Center (library.scconline.org)