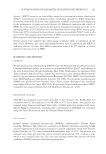
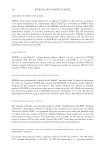
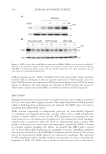
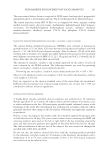
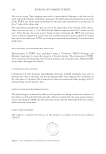
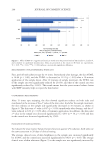
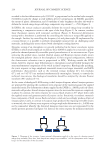
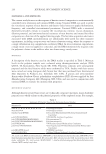
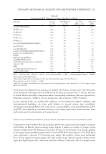
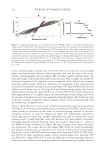
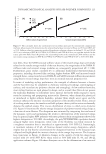
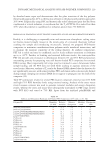
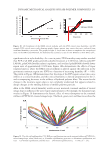
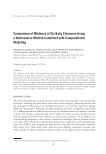
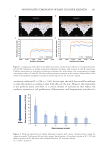
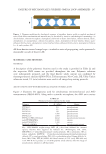
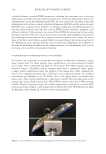
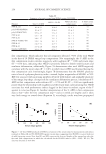
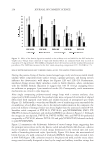
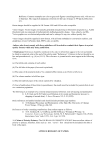
239 NONINVASIVE COMPARISON OF BABY CLEANSER MILDNESS study, each participant acclimated in a temperature- and humidity-controlled room for 15 minutes before having baseline skin measurements taken with Raman spectroscopy (Skin Analyzer Model 3510, RiverD International B.V., Rotterdam, the Netherlands). Next, a patch containing 350 µL of freshly made dilutions of 50% cleanser product solutions in deionized water was applied at each skin site located approximately in the middle of the ventral forearm. After 3 hours, the patches were removed, and the participant acclimated in the temperature- and humidity-controlled room for 20 minutes. A patch with freshly made 1.8% caffeine in deionized water was then applied to each skin site. After 30 minutes, the patch was removed, and the participant acclimated in the temperature- and humidity- controlled room for 10 minutes, followed by final measurements with Raman spectroscopy. No signs of skin redness or dryness were clinically observable following application of the products. STATISTICAL ANALYSIS Spectral analysis was performed using the SkinTools software (RiverD International B.V., Rotterdam, the Netherlands) with the addition of primary spectra for caffeine (Figure 1A) for the chemometric analysis as previously described (11). Data from experimental caffeine penetration profiles were transferred to an agent-based computational model of infant epidermis that takes into account the unique structural and functional properties of infant skin (13). The amount of caffeine penetration in infant skin as predicted by the model was then calculated values from all 11 participants were averaged, and data were analyzed via Student’s t-test. RESULTS AND DISCUSSION A typical caffeine concentration profile in the stratum corneum following topical application of caffeine solution is shown in Figure 1B. If the examined skin site has been pretreated with a cleansing product, then the concentration profile and the total amount of caffeine penetrating the stratum corneum will increase according to the product effect on the permeability barrier. The harsher the product effect, the more caffeine will penetrate. Figure 1. (A) Raman spectrum of caffeine. (B) Typical concentration profile of caffeine penetration into the stratum corneum. AU, arbitrary unit.

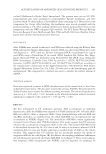
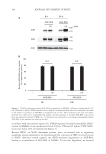
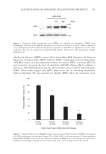
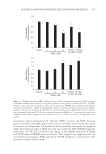
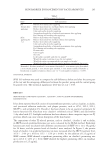
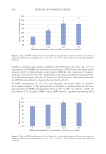
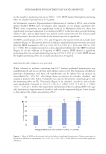
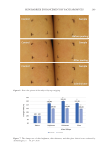
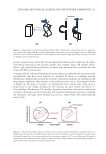
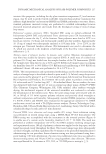
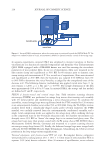
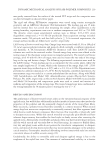
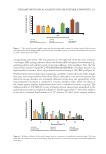
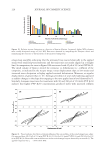
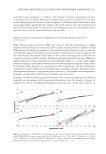
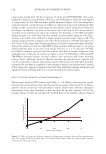
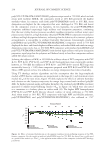
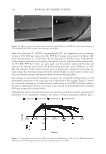
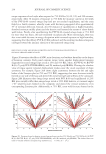
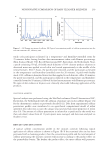
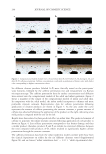
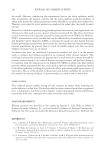
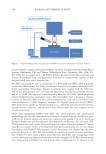
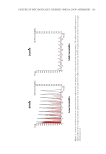
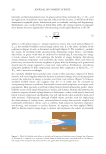
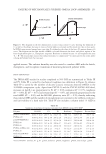
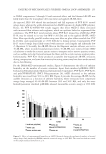
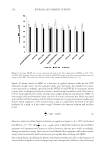
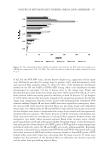
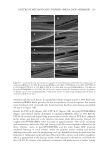
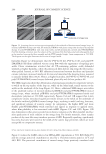
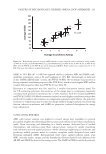
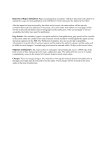
240 JOURNAL OF COSMETIC SCIENCE Six different cleanser products (labeled A–F) were clinically tested on the participants’ volar forearms, followed by the caffeine permeation test and measurement via Raman microspectroscopy. The caffeine penetration data for surface concentration and diffusion were entered into the computational models of the adult and infant epidermis. Figure 2 shows a snapshot of the output of the computational models of infant and adult skin. In comparison with the adult model, the infant model incorporates a thinner and more permeable stratum corneum. Representative data for caffeine penetration following application of cleanser products are shown in Figure 3. As the area under the curve represents the amount of caffeine permeating the stratum corneum, a greater amount of caffeine was observed following the application of the product on the right, indicating a less mild product compared with the one on the left. Results were then related to their predicted effect on infant skin. The predicted amount of caffeine to penetrate the infant stratum corneum following application of each product is shown in Figure 4. Less caffeine penetration corresponds to less barrier damage and thus a milder product therefore, products E and F are milder (no statistical difference between the two) compared with products A–D, which resulted in significantly higher caffeine penetration through the stratum corneum. The caffeine penetration data from the infant epidermis model correlate with those from the clinical experiment on adults for the six different cleansers tested (Supplemental Figure S1) and are linear (“infant simulation data” = 1.13 × “adult experimental data,” Figure 2. Computational models of adult (A, C, E) and infant skin (B, D, F) before (A, B), during (C, D), and after (E, F) caffeine penetration. Caffeine concentration is indicated as gradations of brown color, with darker color corresponding to higher concentration values.
Purchased for the exclusive use of nofirst nolast (unknown)
From: SCC Media Library & Resource Center (library.scconline.org)