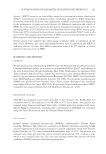
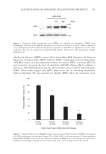
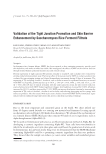
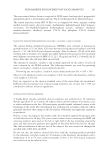
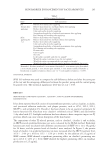
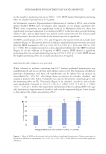
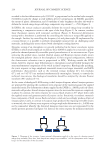
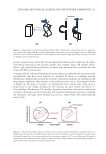
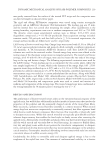
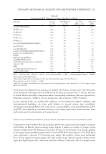
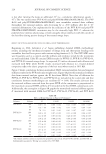
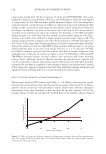
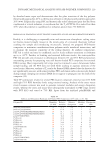
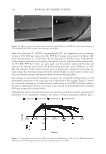
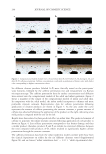
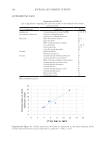
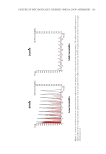
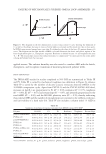
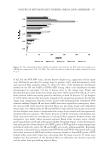
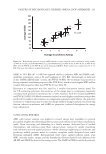
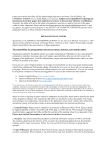
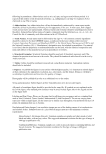
253 Failure of Mechanically Stressed Omega Loop Assemblies applied stresses. The ambient humidity was also varied to correlate AED with the brittle, elastoplastic, and viscoplastic transitions of moisture-plasticized polymer welds. DHSA-AED RESULTS The DHSA-AED results for studies completed at 50% RH are summarized in Tables III and IV. Table III is sorted by mechanical toughness (see definition in Figure 6), whereas Table IV is sorted by the number of discrete acoustic emissions detected (#AED) in the 10 DHSA compression cycles. Apart from PVP K-15 and the PVP K-30/PEG 400 blend, increases in log(M w ) are proportional to F1 (R2 = 0.93), resilience (R2 = 0.75), toughness (R2 = 0.96), E1 (R2 = 0.67), and return slope (R2 = 0.97), and inversely proportional to the total #AED (R2 = 0.83), and the H10/H1 plasticity ratio (R2 = 0.76), thereby indicating that polymer MW and the number of entanglements are essential to the stiffness, resilience, and survivability of a fixed style (10). Table IV also includes a column titled “% AED in g86 / F Brittle fracture g74 / d E = g86 / g74 (or F / d) d A B F Plastic deformation E l st i r g i n Return slope Figure 6. The diagram on the left demonstrates a stress versus strain (γ) curve showing the definition of E, as well as the abrupt decrease in stress as brittle welds are strained and fractured into two or more parts. In DHSA using treated omega loops, note that E is defined as the slope of the force (F) against distance (d) curve. The diagram on the right models a DHSA cycle and illustrates the elastic and plastic regions of the force-displacement plot (i.e., elastoplastic response). Resilience is defined by area “A” and toughness by areas “A + B.” The return slope assesses the residual resistance to compression—it is measured as the acrylic probe is being withdrawn from the tress apex. Table III Summary of mechanical response outcomes from DHSA testing (50% RH)* Polymer H10/H1 F1 E1 Resilience Toughness Return Slope poly(VP/DMAPMA) 0.851 ± 0.02 459 ± 34 194 ± 20 200 ± 11 3439 ± 65 269 ± 24 PVP K-120 0.893 ± 0.01 387 ± 38 206 ± 24 170 ± 12 3276 ± 56 251 ± 20 poly(VP/MAPTAC) 0.852 ± 0.01 344 ± 33 263 ± 34 218 ± 12 3269 ± 48 249 ± 14 PVP K-90 0.868 ± 0.01 347 ± 24 188 ± 27 211 ± 11 2874 ± 62 230 ± 22 PVP K-60 0.876 ± 0.02 315 ± 12 208 ± 36 50.0 ± 9 2465 ± 52 205 ± 17 PVP K-30/PEG-400 0.923 ± 0.01 205 ± 21 79 ± 4 49.4 ± 9 2272 ± 67 177 ± 15 PVP K-30 0.917 ± 0.01 213 ± 11 189 ± 31 23.3 ± 7 1855 ± 38 120 ± 17 Imidized p(IB/MA) 0.956 ± 0.02 174 ± 19 178 ± 37 11.5 ± 7 1735 ± 43 121 ± 12 PVP K-15 0.940 ± 0.02 138 ± 06 88 ± 14 13.7 ± 6 1245 ± 36 94 ± 08 *Units: H10/H1=unitless F1=g E1=g/mm resilience=g•mm toughness=g•mm return slope=g/mm.

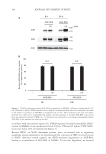
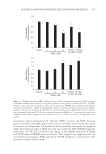
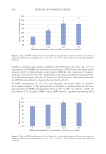
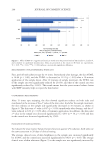
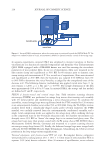
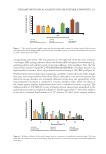
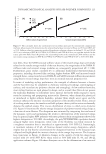
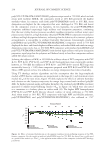
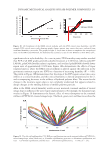
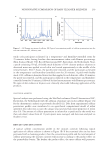
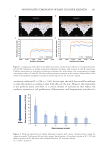
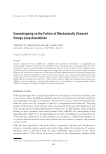
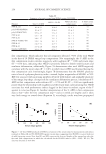
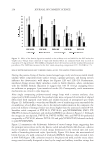
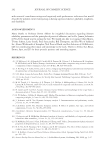
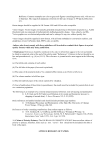
254 JOURNAL OF COSMETIC SCIENCE first compression,” which indicates that all composites liberated ≥70% of the total #AED in the first of 10 DHSA omega loop compressions. Not surprisingly, the % AED in the first compression results correlate negatively with toughness (R2 = 0.90) and return slope (R2 = 0.83) data, indicating that #AED is positively linked to brittle weld fractures and nonlinear deformation additionally, Figure 7A demonstrates that total #AED negatively correlates with the return slope (R2 = 0.87), in which most #AED was liberated during the first compression cycle. Interestingly, Figure 7B demonstrates that the H10/H1 plasticity ratio is less of a polymer plasticity index—instead, higher magnitudes of H10/H1 at 50% RH best associate with increasing numbers of brittle weld failures and negligible plasticity of the omega loop shape. As expected for a nonlinear deformation process, correlations of % AED in first compression with resilience (R2 = 0.70) and E1 (R2 = 0.06) are significantly poorer than the relationship with toughness and the return slope, substantiating that #AED associates less with performance indices logged in the linear viscoelastic region of the F against d curve (see Figure 6). Another interpretation of the % AED in first compression data is that—after the first compression step—cracks in welds are lengthy and it takes very little energy to extend them (Equation 2) accordingly, cracks may have propagated Table IV Summary of acoustic events from DHSA testing (50% RH) Polymer Total # of AED #AED 50 dB #AED after first compression % AED in first compression PVP K-120 81 ± 23 10 ± 2 23 ± 5 72 poly(VP/DMAPMA) 83 ± 17 30 ± 3 25 ± 4 70 poly(VP/MAPTAC) 105 ± 17 13 ± 4 22 ± 4 79 PVP K-90 121 ± 19 13 ± 2 32 ± 3 74 PVP K-60 148 ± 17 13 ± 3 16 ± 5 87 PVP K-30/PEG-400 129 ± 14 18 ± 5 18 ± 5 86 PVP K-15 136 ± 21 16 ± 2 16 ± 6 88 PVP K-30 157 ± 18 14 ± 4 17 ± 3 89 Imidized p(IB/MA) 183 ± 29 45 ± 7 10 ± 4 95 R² = 0.871 0 25 50 75 100 125 150 175 200 50 100 150 200 250 300 Return Slope (g /mm) (g /mm) R² = 0.760 0.84 0.86 0.88 0.90 0.92 0.94 0.96 0.98 50 100 150 200 250 300 Return Slope (A) (B) Figure 7. (A) Total #AED produced in DHSA as a function of the return slope for measurements and indices itemized in Tables III and IV (B) H10/H1 against return slope, suggesting that H10/H1 is a good indicator of weld fracturing events. Note that H1 and H10 represent the detected heights of the omega loop after the first and 10th compressions, in which the calculation for the H10/H1 index = (2H1 – H10) / H1 (11). The data was obtained at 50% RH. #AED H10/H1
Purchased for the exclusive use of nofirst nolast (unknown)
From: SCC Media Library & Resource Center (library.scconline.org)