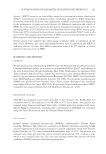
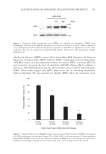
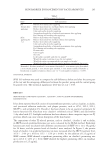
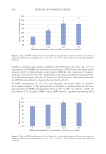
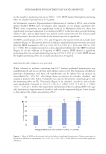
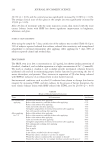
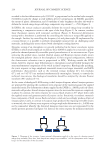
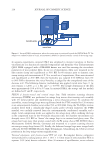
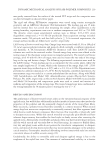
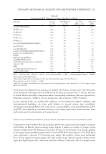
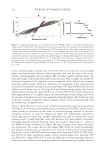
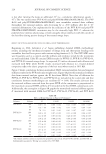
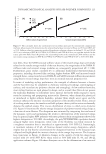
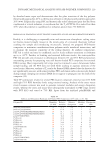
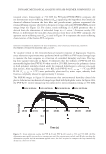
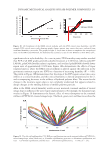
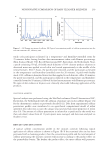
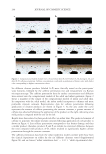
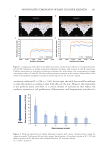
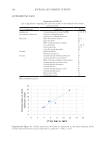
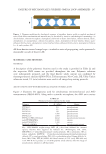
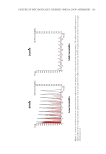
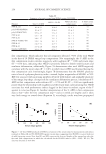
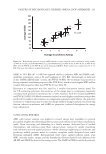
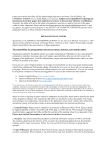
254 JOURNAL OF COSMETIC SCIENCE first compression,” which indicates that all composites liberated ≥70% of the total #AED in the first of 10 DHSA omega loop compressions. Not surprisingly, the % AED in the first compression results correlate negatively with toughness (R2 = 0.90) and return slope (R2 = 0.83) data, indicating that #AED is positively linked to brittle weld fractures and nonlinear deformation additionally, Figure 7A demonstrates that total #AED negatively correlates with the return slope (R2 = 0.87), in which most #AED was liberated during the first compression cycle. Interestingly, Figure 7B demonstrates that the H10/H1 plasticity ratio is less of a polymer plasticity index—instead, higher magnitudes of H10/H1 at 50% RH best associate with increasing numbers of brittle weld failures and negligible plasticity of the omega loop shape. As expected for a nonlinear deformation process, correlations of % AED in first compression with resilience (R2 = 0.70) and E1 (R2 = 0.06) are significantly poorer than the relationship with toughness and the return slope, substantiating that #AED associates less with performance indices logged in the linear viscoelastic region of the F against d curve (see Figure 6). Another interpretation of the % AED in first compression data is that—after the first compression step—cracks in welds are lengthy and it takes very little energy to extend them (Equation 2) accordingly, cracks may have propagated Table IV Summary of acoustic events from DHSA testing (50% RH) Polymer Total # of AED #AED 50 dB #AED after first compression % AED in first compression PVP K-120 81 ± 23 10 ± 2 23 ± 5 72 poly(VP/DMAPMA) 83 ± 17 30 ± 3 25 ± 4 70 poly(VP/MAPTAC) 105 ± 17 13 ± 4 22 ± 4 79 PVP K-90 121 ± 19 13 ± 2 32 ± 3 74 PVP K-60 148 ± 17 13 ± 3 16 ± 5 87 PVP K-30/PEG-400 129 ± 14 18 ± 5 18 ± 5 86 PVP K-15 136 ± 21 16 ± 2 16 ± 6 88 PVP K-30 157 ± 18 14 ± 4 17 ± 3 89 Imidized p(IB/MA) 183 ± 29 45 ± 7 10 ± 4 95 R² = 0.871 0 25 50 75 100 125 150 175 200 50 100 150 200 250 300 Return Slope (g /mm) (g /mm) R² = 0.760 0.84 0.86 0.88 0.90 0.92 0.94 0.96 0.98 50 100 150 200 250 300 Return Slope (A) (B) Figure 7. (A) Total #AED produced in DHSA as a function of the return slope for measurements and indices itemized in Tables III and IV (B) H10/H1 against return slope, suggesting that H10/H1 is a good indicator of weld fracturing events. Note that H1 and H10 represent the detected heights of the omega loop after the first and 10th compressions, in which the calculation for the H10/H1 index = (2H1 – H10) / H1 (11). The data was obtained at 50% RH. #AED H10/H1

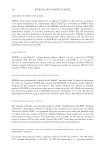
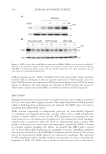
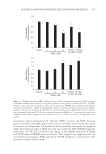
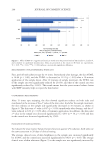
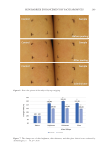
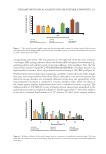
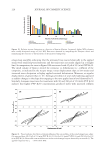
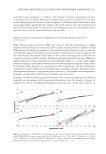
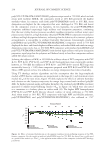
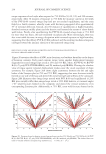
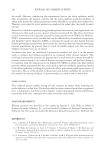
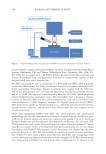
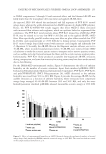
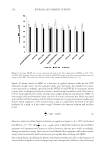
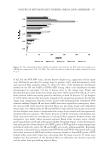
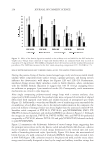
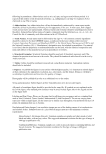
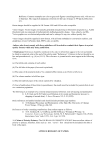
255 Failure of Mechanically Stressed Omega Loop Assemblies in DHSA compressions 2 through 10 with minimal effort, and the liberated dB-SPL was likely lower than the microphone detection limit and applied dB-SPL filter. As expected, PEG 400 altered the mechanical and AE responses of PVP K-30–treated omega loops, wherein the welds demonstrated an #AED response of a higher MW polymer. Hence, the PVP K-30/PEG-400 results suggest that lower #AED is likely associated with increased film softness and toughness, which are qualities linked to augmented film compliance. The PVP K-15 trend anomaly, where PVP K-15 showed less #AED than PVP K-30, may be related to its very low MW ( 10 kDa) and to the applied dB-SPL #AED filter. More specifically, parallel studies using neat films on glass slides revealed that PVP K-15 films crack spontaneously at 50% RH due to drying stresses. Consequently, PVP K-15–treated omega loops likely started with non-zero crack lengths and inherently low σ f (Equation 2). Secondly, the dB-SPL filter in the Exponent analysis software was set to 30 dB-SPL, where recorded sound pressures below 30 dB-SPL were removed from #AED calculations to make the acoustic spectra easier to interpret and to remove spurious events, such as audible stick-slip friction between the fibers and the acrylic texture analyzer probe. Unfortunately, PVP K-15 likely produced acceptable low-magnitude dB-SPL emissions during compression, and some low-intensity fracturing events may have been undercounted due to data filtering. For the DHSA-AED environmental studies, Figure 8 demonstrates the effect of ambient humidity on the number of acoustic emissions. Apart from imidized p(IB/MA) (INCI: Isobutylene/Ethylmaleimide/Hydroxyethylmaleimide Copolymer), PVP K-60, PVP K-90, and poly(VP/MAPTAC) (INCI: Polyquaternium 28), #AED decreased as the ambient humidity was raised from 50% to 60% RH. Figure 9 provides the average dB-SPL for the audible emissions as a function of ambient humidity, where emissions from compressed omega loops averaged 45–60 dB-SPL between 30% and 50% RH, and only the more humidity-resistant imidized p(IB/MA) released measurable acoustic energy at 90% RH. Figure 8. Effect of environmental humidity on #AED liberated during the mechanical analysis of treated omega loops. Only imidized p(IB/MA) emitted acoustical energy at 90% RH. The error bars indicate trends in the sample standard deviation (n ≥ 5).
Purchased for the exclusive use of nofirst nolast (unknown)
From: SCC Media Library & Resource Center (library.scconline.org)