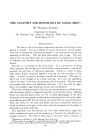
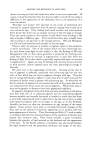
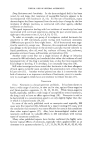
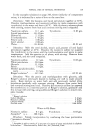
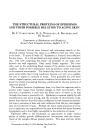
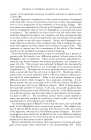
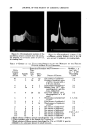
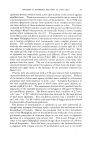
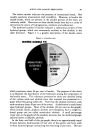
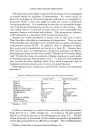
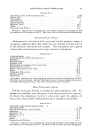
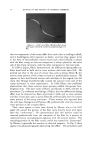
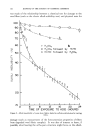
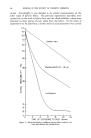
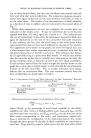
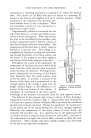
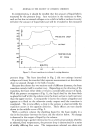
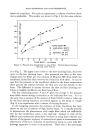
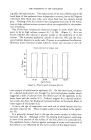
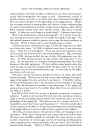
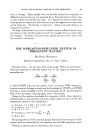
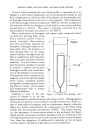
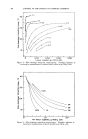
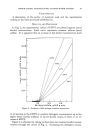
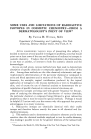
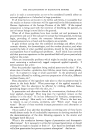
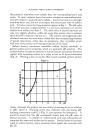
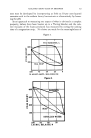
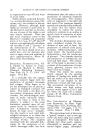
374 JOURNAL OF THE SOCIETY OF COSMETIC CHEMISTS In interpretation, it should be recalled that the amount of liquid held is measured by the pressure drop. Any variation in the resistance to flow, such as that due to internal collapse or to a shift in bulk or surface viscosity will alter the amount of liquid held and will be revealed by the measured 80 70 60 50__ 44 40 :56 _ 0 •_._•_.•_•-'•L• OUTPUT --t__ .• MINUTES 2O 4.0 60 Figure 2.--Foam transitions in column of varying diameter. TEMPERATURE OF FOAM pressure drop. The foam described in Fig. 2 did not undergo internal collapse and it may be remarked that separate measurements on the solution show no unusual changes in the bulk viscosity. Because the column has two sections each of different diameter, the foam transition reveals itself in another way. Depending on the direction of the transition, the foam either sheds or retains a considerable amount of liquid. With the present arrangement (Fig. 1), the liquid shed by the foam finds no place for itself within the column since the lower section is much narrower than the upper section. Consequently it leaves the column altogether and appears as a flood on the otherwise steady output until the transition is completed. The inverse effect, a drop in the output, is observed while the transition occurs in the opposite direction. These effects are very clearly shown in the middle curve of Fig. 2. With a uniform column the shedding liquid by the foam results in a rise in the boundary between the foam and the solution below. No change is observed in the output of liquid by the column. It is interesting to gather information by an alternate procedure, whereby at selected, fixed temperatures, the pressure drop is determined for a series of widely differing flow rates. The temperatures selected are above and

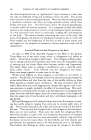
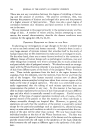
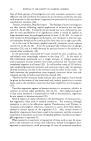
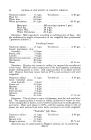
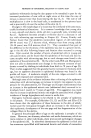
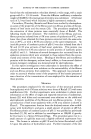
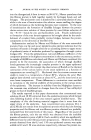
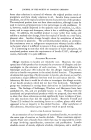
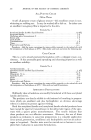
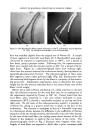
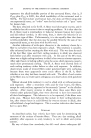
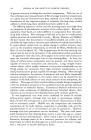
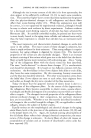
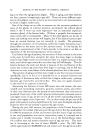
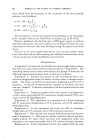
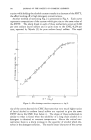
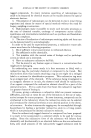
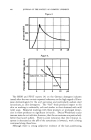
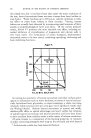
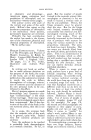
FOAM TRANSITIONS AND FOAM PERSISTENCE 375 below the transition. For such an experiment, a column of uniform diam- eter is preferable. The results are shown in Fig. 3 for the same solution o 40 ,• I i o o 20 / • • ß unextrocted, :56.0øC ' • ø 0 " , 44.0øC I0 ß ex.?roc?ed0 •6. OøC • • 44. OøC 2 4 6 8 I0 12 14 16 FLOW RATE - ml/minute Figure 3.--Pressure drop (liquid held) vs. rate of flow. Vertical distance between inlet and outlet 42.6 cm. as in Fig. 2. The upper curve refers to the slow draining foam, the lower curve to the fast draining foam. Also presented are data at the same temperatures for 0.025 per cent solution of Duponol ME from which the. unsulfated alcohol has been removed by extraction with ether. It can be seen that the presence of the unsulfated alcohol at the lower temperature alters greatly the relation between the flow rate and the density in the foam. The difference in density between the slow and fast draining con- ditions is roughly twofold at any fixed rate of flow. The line connecting points At and At' gives the change in the pressure drop which occurs during a transition at the indicated flow rate. It is at the same time a measure of the amount of liquid which is shed or taken up by the foam during transition and which appears as the hump or trough (Fig. 2) in an experiment with a column of varying diameter. In the foregoing discussion the existence of foam transitions has been shown by the use of columns of high density foam. It is equally possible to demonstrate the phenomenon with single films which are sufficiently thin for the interference colors to be observed. Indeed, in view of the difficult and cumbersome procedures involved in using foam columns and because of the greater economy of material and speed of measurement the observation of the rate of descent of interference bands in a test tube film drainage apparatus is much to be preferred. There also is the advantage
Purchased for the exclusive use of nofirst nolast (unknown)
From: SCC Media Library & Resource Center (library.scconline.org)