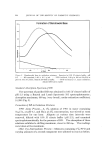
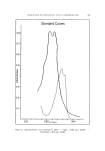
ß 382 JOURNAL OF THE SOCIETY OF COSMETIC CHEMISTS of checking out the product's properties in terms of its specifications or blueprint. They use consumers as pilot testers to tell them what is right and what is wrong with the product if the product passes the pilot test it can be released to the marketing department if it fails, the research group should have obtained useful information so that the product can be purposefully modified. This paper considers the application of consumer panels in pilot product testing. For a number of years the authors have been pilot- testing products with relatively small consumer panels of so-called articulate discriminators (1). Discriminating consumers are persons who can accurately distinguish a product's properties. To decide if they are flavor discriminators, one evaluates their responses against laboratory flavor analyses of the test product. Understandably, if a consumer panelist is unable to communicate his observations, it is not possible to judge if he is a discriminator. Therefore, he must be articu- late. Our source of articulate discriminators is the employees of our company's local operations. Since size and type of panel are open to contention and scrutiny, research was undertaken to compare the per- formance of a small, local panel of articulate discriminators with that of a more conventional consumer panel: a larger, national quota-sample of consumers. The local panel consisted of 89 ADL families (403 persons) sdected because they were known to discriminate. The national panel consisted of 249 families (832 persons): 16% West, 26% Northeast, 29% Central, and 29% South. They all tested the same two coded toothpastes ("R" and "W") during the same two-week period. Responses were obtained through questionnaires and hedonic scores. Questionnaires for the local panel (except for hedonic score cards) were entirely free re- sponse. Those for the national panel were both structured and open- ended. The local panel was instructed to use the toothpastes alter- nately the national panel was instructed to use each of the pair for one week (order of sample use was balanced). The first step in comparing the performance of these two panels showed virtually complete paralleling in over-all preference favoring Toothpaste R over Toothpaste W, distribution of hedonic scores, and correlation of flavor preference with over-all preference (2). From this horizontal analysis it was concluded that the general reactions to a nationally used product--in this case, toothpaste--were similar from consumer panelists whether they were selected to represent a national quota-sample or to represent known product discriminators.

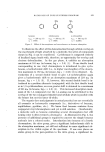
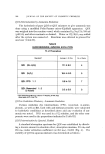
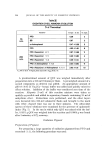
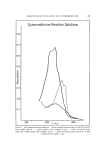
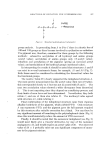
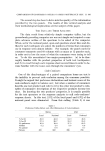
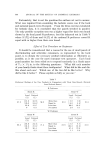
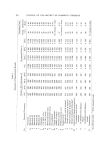
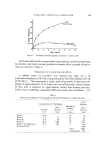
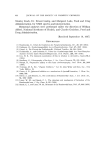
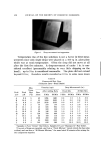
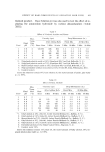
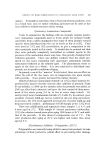
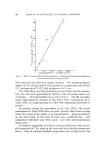
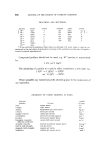
COMPARISON OF CONSUMER PANELS IN PAIRED PREFERENCE TEST. I[ 383 The second step has been to delve into the quality of the information provided by the two panels. The results of this vertical analysis and their methodological implications are the subject of this paper. THE DATA AND THEIR ANALYSES The data result from relatively simple computer tallies, but the groundwork preceding computer use was not simple and required a com- plete advance outline of the questions to be asked of the computer. When, as for the national panel, open-end questions about likes and dis- likes for each toothpaste are asked, the numbers of terms that consumers use in response seem almost infinite. For example, the punch cards for consumer comments used 69 columns with as many as 12 punches each, in order not to lose the sense of what the consumers were trying to tell us. To do this necessitated two major prerequisites: (a) to be thor- oughly familiar with the product properties of both test toothpastes and (b) to read through each response sheet several times in order to be- come familiar with the issues seen through the consumers' eyes. Code-Confusers One of the disadvantages of a paired comparison home-use test is the inability to prevent code-confusion among the consumer panelists. It might be argued that preference declarations and hedonic scores of the code-confusers ought to balance out but when a number of consumers describe one test product and refer to it by the other test product's code, tallies of consumers' descriptions of the respective products become less clear. By knowing the two products' properties, it is usually possible for the test operators or the response analysts to cull code-confusers' response sheets. In this test, 2.5% of the local panel and 8.3% of the national panel were eliminated. From this culling (Table I) it was Table I Preference Tallies Before and After Elimination of Code-Confusers Before After Local National Local National % for R 52.6 45.9 54.0 48.8 % for W 27.3 29.7 25.2 25.3 No preference 16.9 19.4 17.5 20.5 Neither 3.2 4.4 3.3 4.9 No answer . .. 0.6 ... 0.7 Persons 403 832 388 763
Purchased for the exclusive use of nofirst nolast (unknown)
From: SCC Media Library & Resource Center (library.scconline.org)