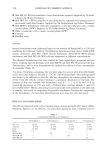
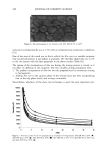
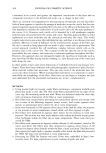
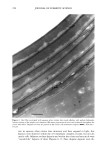
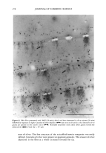
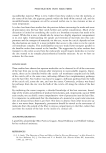
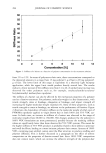
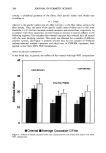
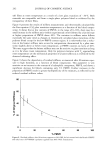
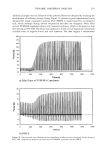
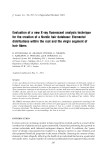
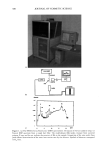
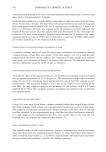
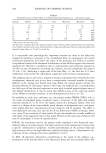
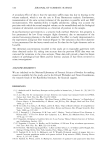
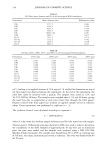
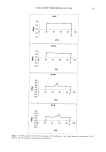
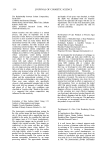
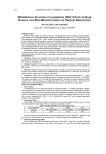
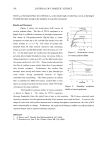
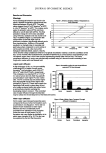
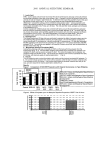
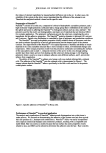
300 JOURNAL OF COSMETIC SCIENCE C ß ß Jl '•s •a keV Figure 1. (a) The ITRAX X-ray fluorescence (XRF) spectrometer. (b) Layout of the hair analysis setup. (c) Typical XRF spectrum from a single hair fiber. The molybdenum (Mo) peaks emanate from scattered primary X-rays and do not indicate the presence of Mo in the sample. Integration of the area under these peaks allows determination of the mass cross section seen by the detector. Symbols of elements correspond to K,, lines.

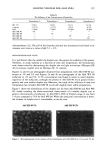
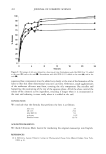
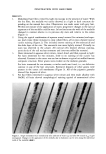
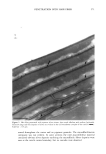
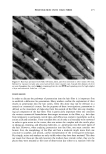
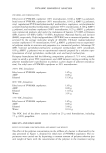
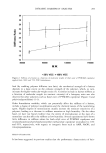
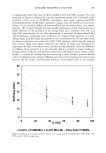
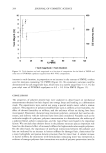
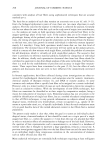
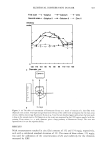
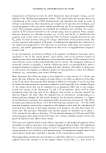
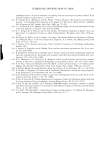
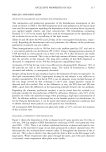
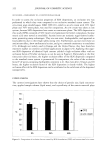
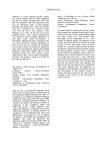
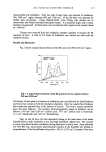
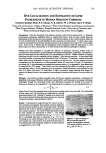
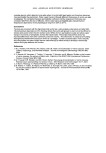
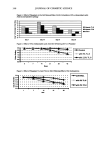
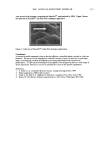
ELEMENTAL DISTRIBUTION IN HAIR 301 1000 10o 10 ß cJ K ß ½r ß ß Mn ee ee Cu Fe Ni Zn 0.1 I i i i i i i ! i i i i i , 0 2 4 6 8 10 12 14 Energy, keV Figure 2. Diagram of detection limits for different elements in hair. The lower sensitivity for light elements Z20 (Ca) is essentially related to the low energy of the fluorescent X-ray and consequent absorption of X-ray energies in the matrix and the air volume between sample and detector. Detection limits for other elements can be estimated from the graph, using their respective fluorescent X-ray line energies (cf. ref. 7 for description of the instrument). especially developed for microbeam analysis using the capillary technique. The program is of the fundamental parameter type and has been described earlier (20). HAIR PREPARATION AND ANALYSIS The material in this investigation was previously used in a PIXE study (9). The details of the sample collection criteria were given in that paper. In short, hair fibers were collected by plucking them from the temporal area 1.5-2 cm above the right ear of 63 normal, healthy, Caucasian individuals, who represented at least the third generation of Swedish citizens. A triplet of anagen hairs (in 20 cases six hair fibers) from each individual was selected for the study. In the present study an area close to the root was chosen in each hair fiber. This section was approximately 5 mm away from the part of the strand earlier analyzed using PIXE. One set of hairs of the double triplets had been cleaned prior to the earlier PIXE analysis. No further cleaning was done prior to analysis. However, as expected, it was found that particles on the hair fiber surface could affect the results. Therefore, the surface of the hairs were checked using the video cameras. Particles were removed using a fine brush. Hair fibers found to have extremely high values for some elements were cleaned in chloroform:methanol (1:1) for one minute with continuous stirring and were subse- quently reanalyzed. If values were then considered within the normal range, no further step was taken to control the cleanliness of the fiber. Furthermore, for each element, fibers giving extremely high concentration values were reanalyzed after cleaning. If the
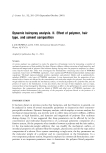
Purchased for the exclusive use of nofirst nolast (unknown)
From: SCC Media Library & Resource Center (library.scconline.org)