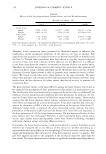
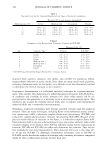
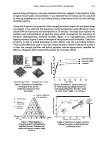
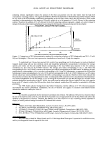
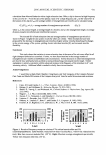
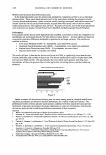
430 JOURNAL OF COSMETIC SCIENCE A looK BEHIND THE SALT CURVE: THE LINK BE TWEEN RHEOLOGY, S TRUCTURE AND SALT CONTENT IN SHAMPOO FORMULATIONS Introduction Kevin Penfield, Ph.D. Uniqema, 900 Uniqema Blvd., New Castle, DE 19720-2779 kevin.penfteld@uniqema.com Shampoos are viscoelastic materials, demonstrating both viscous (liquid-like) and elastic (solid like) flow properties. They consist of wonn-like micelles - equilibrium structures strongly dependent on composition variables. The interactions between micelles are responsible for the viscoelastic behavior of shampoos: entanglements, branching points, and adhesive contacts thicken these systems, while reptation (disentanglement through snake-like motion), breaking of the micelles, and sliding of contact points are the principal mechanisms of stress relaxation [l-6]. When exhibiting a single relaxation time, the viscoelastic behavior of the micellar solutions can be fit to a simple Maxwell model consisting of a spring and dashpot connected in series. The spring is characterized by a spring constant, G, while the dashpot is characterized by a viscosity, TJ. These two are related, through the relaxation time, as follows: .,, = G X t (Eq. I) Dynamic rheological measurements. in which samples are subjected to an oscillating shear stress, reveal both the viscous and elastic behavior of surfactant solutions. In particular, frequency sweeps show the dependence of the viscous and elastic moduli (G" and G') and the complex viscosity (11•) on the rate of the oscillatory motion. For a Maxwell fluid, the frequency at which the curves for the viscous and elastic moduli intersect corresponds to the reciprocal of the relaxation time further, the modulus value at this intersection is one-half the spring constant. The complex viscosity at low frequency is equal to the zero shear viscosity, TJo- Thus, for a Maxwell fluid, the material modulus (G',,J, relaxation time {t,), and zero shear viscosity, TJo, can all be obtained in one simple measurement. Experimental Eight formulations were examined at 10 ° C and 20° C using a Rheometric Scientific DSR-200 stress rheometer. Stress sweeps of each sample were first recorded to detennine the stress range for linear response. Frequency sweeps were then recorded from these, the complex viscosity at low frequency, the relaxation time, and the modulus value at which G' and G" intersect were determined. Results and Discussion Low-shear viscosity, crossover modulus, and relaxation time as functions of salt content are presented in Figure I {left) for one formulation. These and similar results for the other fonnulations show that in these systems the relaxation time tracks the rise and fall of the low-shear viscosity, while the modulus steadily increases with salt concentration. The addition of cocamidopropyl betaine to either SLES or ALES/ALS surfactant solutions increases the maximum relaxation time, and thus the viscosity. The further addition of PPG-2 hydroxyethyl cocamide or PPG-2 hydroxyethyl coco/isostearamide shifts the maximum relaxation time to lower salinity while boosting viscosity at low salt concentration through an increase in the modulus. Further structural information can be obtained from features of the frequency sweep above the crossover frequency [2,5]. In this region, the increased importance of additional relaxation modes results in

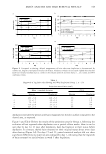
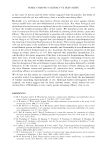
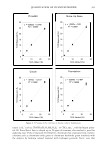
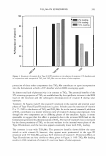
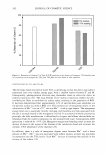
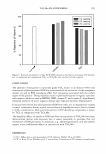
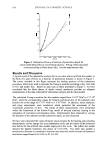
2006 ANNUAL SCIENTIFIC SEMINAR 431 a deviation from Maxwell behavior with a single relaxation time. Often, a dip is observed at high frequency in the curve for G". From the ratio of the plateau value of G' at high frequency (G'ct)) to the value ofG" at the bottom of this dip (G"min), the average number of entanglements per mice lie can be calculated using: G' ..,/G"min �Lelle= average number of entanglements per mice lie (Eq.2) where Le is the contour length, or average length of a micelle, and leis the entanglement length, or average distance along the micelle between intermicellar contacts. The rise and fall of both relaxation time and average number of entanglements per micelle is shown in Figure I (right) for one system results for others are similar. Three mechanisms have been proposed for the decrease in entanglements per mice lie at higher salinity: mice liar branching [7] changes in the scission energy of the system, yielding shorter individual micelles [8] and increased mice liar flexibility. Conclusion This study shows that variation in stress relaxation time is the cause of the salt curve effect for all eight shampoo formulations examined. Further, we have found maxima in the average number of entanglements per micelle at intermediate salt concentrations. Similar decreases in observed entanglements per micelle have alternately been ascribed to increased branching or decreased micelle length. Neither explanation is entirely consistent with the observed increase in the frequency of the minimum in G" with increasing salinity. Additional effort is needed to clarify these inconsistencies. Acknowledgements I would like to thank Mark Chandler, Craig Queen. and Tom Szurgyjlo of the Uniqema Personal Care Team and Sheila DiCostanza of the Uniqema Analytical Team for useful discussions and assistance. References I. Cates, M. E.and Candau. S. J., J. Phys. Condens. Matter, 2, 6869. (1990). 2. Rehage, H. and Hoffmann, H., Molecular Physics, 74,933, (1991). 3. Balzer. D., Varwig, S., and Weihrauch, M., Colloids Surfaces A: Physicochem. Eng. Aspects, 99, 233, (1995). 4. Magid, L. J., J. Phys. Chem 8,102, 4064. (1998). 5. Hassan, P. A., Narayanan, J., and Manohar, C., Current Science, 80, 980, (2001). 6. Lequeux, F., Europhys. Lett., 19,675, (1992). 7. Khatory, A., Lequeux, F., Kem, F., and Candau, S. J., Langmuir, 9, 1456, (1993). 8. Koehler, R. D., Raghavan, S. R., and Kaler, E. W., J. Phys. Chem. B, 104, 11035, (2000). 200 2000 • ii 1500 i 150 C 8 "$ 100 1000 o :11 soo I s: • 50 "i 0 0 a:: 1.5 2 3 3.5 4 5 5.5 6 %NaCl ,a 20.0 C .I I! 15.o IE 10.0 I I 5.o ifi 0.0 3 4 5 6 7 8 9 % NaCl 6000 I 4000: 0 2000 I .!I 0 I Figure I. Results of frequency sweeps on solution of7% sodium laureth sulfate and 3% cocamidopropylbetaine. Left: Red bars: measured low-shear viscosity (Pa.s) Yellow line: relaxation time (ms) Blue line: crossover modulus (Pa). (20° C). Right: Blue bars: average entanglements per micelle Yellow line: relaxation time (ms). (10° C).
Purchased for the exclusive use of nofirst nolast (unknown)
From: SCC Media Library & Resource Center (library.scconline.org)