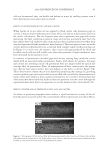
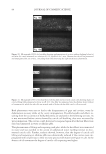
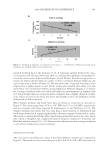
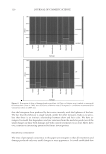
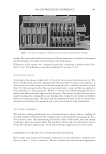
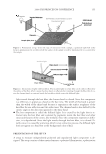
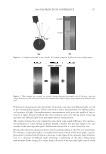
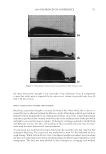
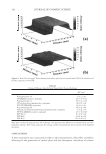
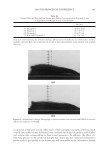
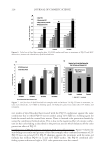
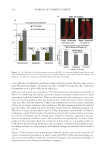
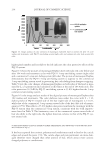
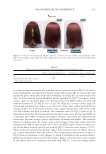
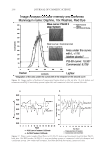
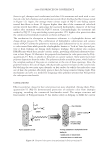
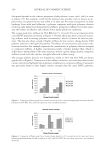
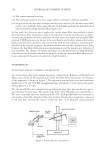
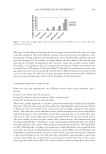
JOURNAL OF COSMETIC SCIENCE 222 fi rst and second cycle respectively. For dark brown and dark red color, a one cycle, 45 minute dyeing process was used. The mannequin head was divided into two half sections. The right side of head was treated and washed with a regimen of formulations containing polyquaternium-55 the left side was washed and treated with a commercial color lock product. Ten wash and treatment cycles were conducted on each mannequin test. At the end of 2×, 5× and 10× wash and treatment cycles, digital pictures were taken of the man- nequin head. Pictures consisted of both sides of the head as well as front and back. Hunter L, a, b values were measured on these sections of the head as well. COLOR ANALYSIS METHODS Hunter L, a, b reading. Color changes were measured by using HunterLab Ultra Scan color- imeter. Color readings of Hunter L, a, b parameters were obtained with “specular in- cluded” and D65 light source settings. Hair color changes after washes were determined by dE. dE was calculated using equations 1 and 2 to evaluate color change: -L a - a b -b dE = ((L t o t o t o ) ( ) ( ) )1 /2 2 2 2 + + (1) dC = ( a - a b -b t o t o ( ) ( ) ) . /2 2 2 1 + (2) where Lo, ao, bo and Lt, at, bt are measured Hunter L, a, b color parameters before and after the wash and treatment cycles, respectively. The larger value of dE refl ects a greater change of color. The values of L, a, b readings on each hair tress represent an average of ten measurements, each corresponding to a different site on the hair but within the same area (a 0.39 diameter circle) before and after washes. The result of each test is repeated at least 3 times. The amount of color protection from a treatment is calculated from equa- tion 3: % Color protection = % dE = (dEcontrol – dEtreatment) × 100 dEcontrol (3) where dEtreatment is the total color changes after washes and protective treatment dEcontrol is the total color change after washes without protective treatment and %dE over 15% or a dE values of 1 for red color is generally perceivable by eye. Taking digital pictures. Digital pictures of hair tresses were obtained by scanning the tresses using EPSON Perfection 4990 photo scanner. Digital pictures of mannequin were taken using a professional camera. Image analysis of digital pictures. Digital pictures of a mannequin were cropped into equal areas from both the right side and left side of the picture using Adobe Photoshop soft- ware, CS 3 edition. The cropping was done either from the front or the side areas of the head. Image analysis of digital pictures was performed using Image Pro software. Lumi- nosity histogram analysis of the cropped pictures was obtained. The histogram consists of a plot of pixels versus color scale of luminosity. The number of pixels indicates the color intensity of the hair sample. The darkness of the hair sample was derived from population of darker pixels which was calculated by integrating the area under the curve left to the middle point of the curve.

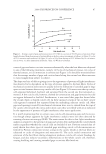
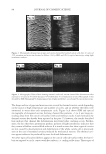
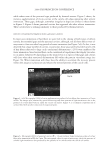
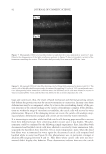
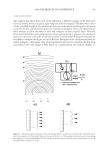
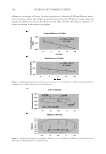
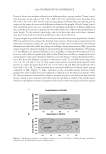
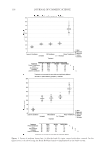
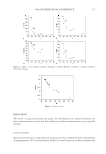
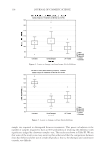
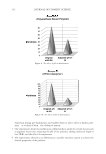
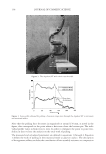
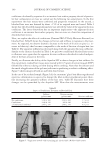
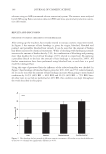
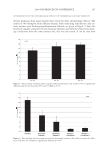
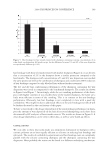
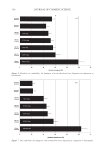
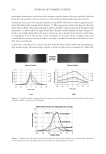
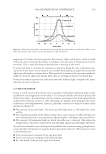
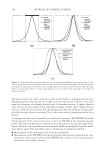
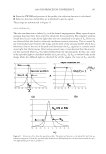
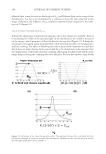
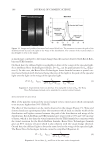
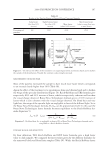
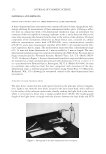
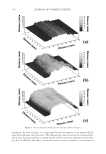
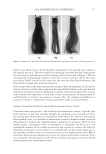
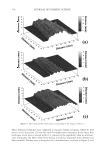
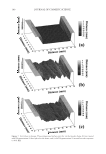
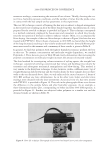
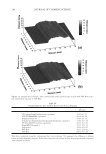
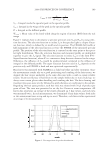
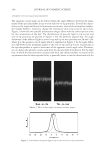
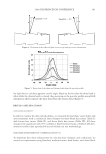
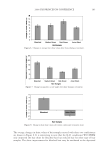
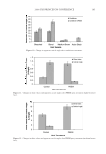
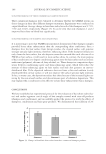
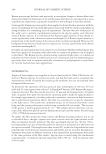
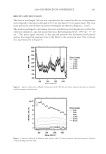
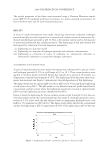
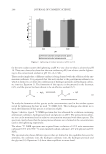
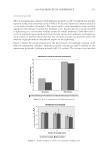
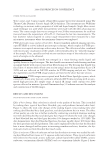
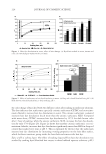
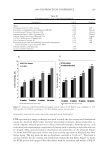
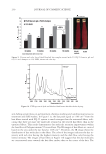
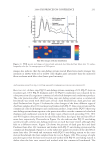
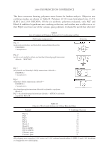
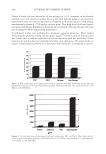
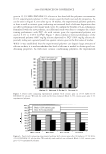
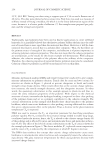
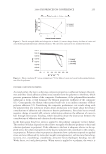
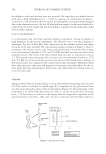
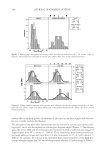
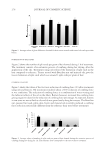
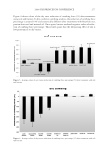
2008 TRI/PRINCETON CONFERENCE 223 OTHER PHYSICAL ANALYSIS Water contact angle. Contact angles of hair fi bers against water were measured using The Thermo Cahn Dynamic Contact Angle (DCA) Analyzer. The instrument uses Wilhelmy technology to measure surface properties of solid and liquid samples. Single fi ber contact angle technique was used where measurements were made with the fi ber advancing into water. The contact angle data was an average of over 20 fi ber measurements for each hair tress and meets the requirement of Cos θ 0.1 between the last two measurements. The hair diameter values required in contact angle measurement were measured by a laser micrometer instrument where the maximum diameter was employed. FTIR spectroscopic image analysis of hair fi bers. Fourier transform infrared imaging spectros- copy (FT-IRIS) is a novel infrared spectroscopic technique, which couples an FT-IR spec- trometer to an optical microscope with an array detector. The collection of data, combined with microscopic visualization of the sample, will essentially allow for “infrared imaging” of the sample. Thus, spatially resolved micron-resolution maps of the molecular compo- nents of sample can be obtained. Sample preparation. Hair bundle was emerged in a tissue freezing media liquid and quickly frozen in liquid nitrogen. The hair bundle was mounted with freezing medium on sample holder with cross section of hair fi bers facing out. The freezing hair bundle was sliced into a 4 micron thick of hair cross section using a micro slicing machine (Leica CM 1850) and was collected on CaF2 IR window for FT-IR imaging analysis use. The hair dye ingredients used for FTIR image analysis are listed in the above hair dye section. FTIR imaging. FT-IR images were acquired with Perkin Elmer Spotlight system, which consists of a linear array mercury-cadmium-telluride (MCT) detector along with an auto- mated high precision XY sample stage. A typical IR image could contain over 2000 spectra collected in minutes. Spectral Dimensions Isys 3.0 software was used for analysis and construction of the IR images. RESULTS AND DISCUSSIONS FACTORS AFFECTING HAIR COLOR FADING Effect of hair damage. Hair color loss is related to the quality of the hair. This is studied by soaking three types of dyed hair: bleached, grey and piedmont (natural white hair). Figure 1a shows the total color changes of the soaking liquors versus soaking time after soaking dyed bleached hair, dyed grey hair, and dyed piedmont hair in water. The effect of hair quality on color loss is further studied by conducting a multiple shampoo washing test with dyed bleached hair and dyed grey hair. Figure 1b shows the total color changes of dyed bleached hair and dyed grey hair after 10× shampoo washes by 12% SLES. The data demonstrates that dyed bleached hair lose dye more rapidly, about 40% faster than the dyed grey hair and dyed piedmont. This can be explained by the fact that the bleached hair is more damaged and has pores in increasing numbers and sizes, therefore, the dye molecules leach out from bleached hair much easily. Effect of surfactants. Effect of surfactant on hair dye dissolution in water was studied by soak- ing dyed bleached hair tresses in 1% aqueous surfactant solution. Three typical surfactants were selected in this study: anionic surfactant, sodium lauryl ether sulfate (SLES) cationic surfactant, cetrimonium chloride (CETAC) and coco trimonium chloride. Figure 2 shows
Purchased for the exclusive use of nofirst nolast (unknown)
From: SCC Media Library & Resource Center (library.scconline.org)