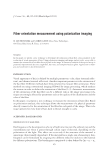
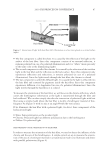
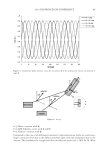
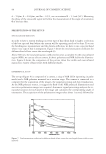
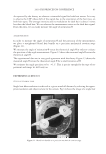
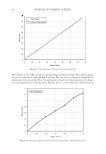
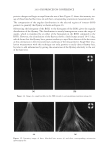
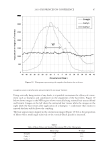
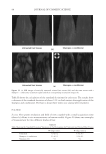
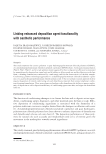
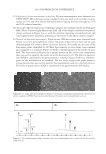
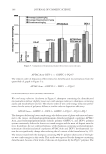
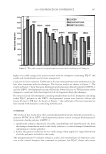
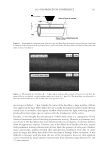
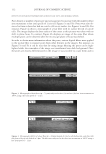
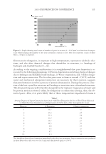
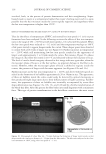
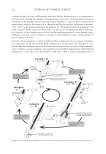
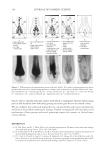
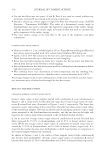
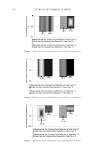
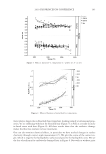
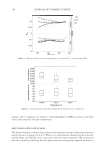
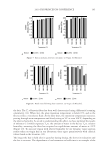
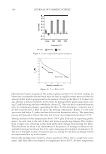
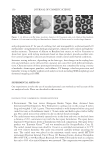
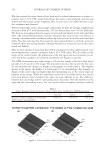
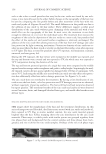
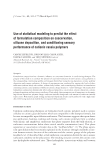
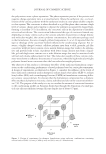
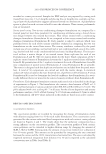
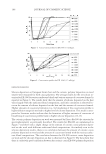
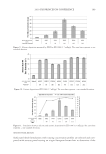
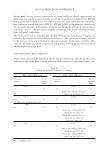
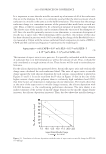
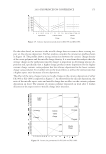
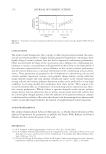
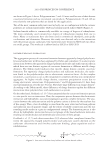
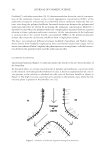
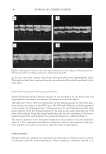
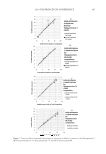
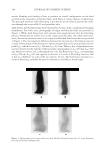
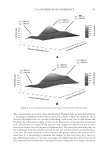
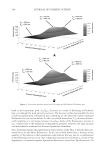
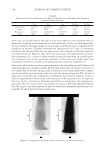
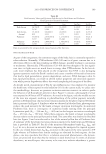
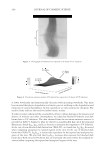
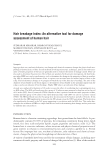
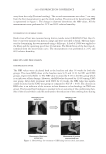
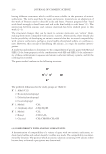
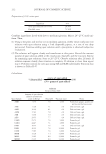
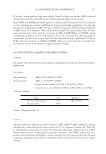
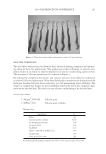
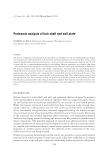
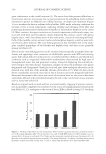
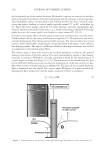
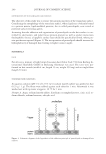
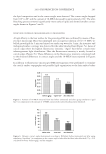
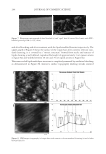
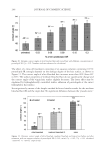
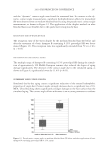
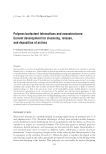
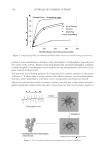
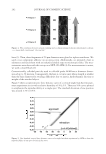
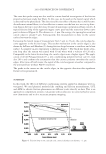
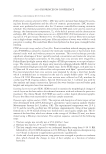
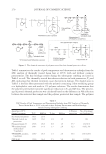
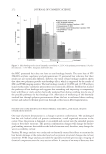
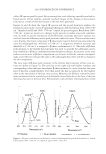
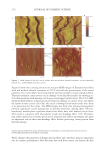
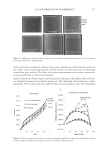
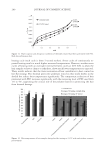
JOURNAL OF COSMETIC SCIENCE 94 Figure 12. Measured angle θ versus the theoretical angle θ. fi ber (blond) in the NIR (a) and its corresponding orientation image (b) In those images, the pixel resolution is about 80 μm × 80 μm. We can detect without any problem the orientation of the single hair fi ber. An application of single hair fi ber imaging is the detec- tion and identifi cation of fl yaway hair. Flyaway hair is caused when hair strands pick up Figure 13. Measured angle θ versus the theoretical angle θ for a small variation of θ.

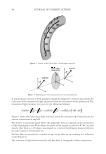
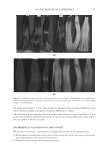
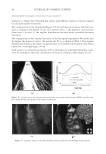
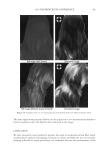
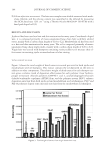
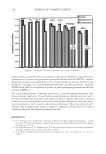
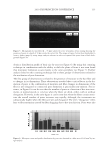
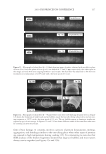
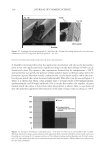
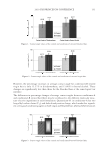
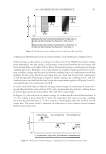
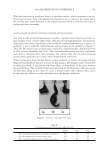
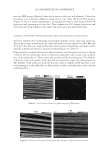
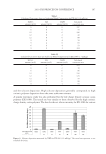
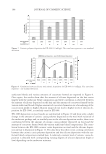
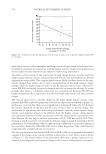
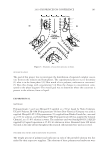
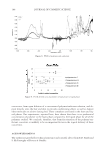
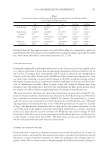
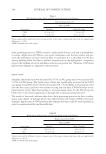
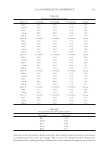
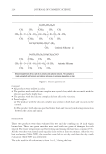
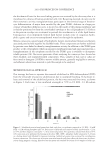
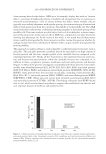
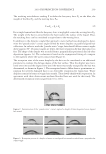
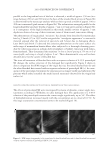
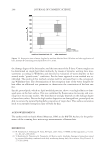
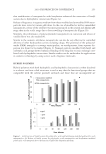
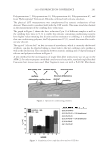
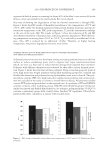
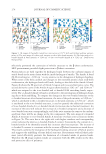
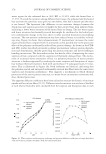
2010 TRI/PRINCETON CONFERENCE 95 positive charges and begin to repel from the rest of hair. Figure 15 shows the intensity im- age of three bleached hair tress (a) and their corresponding orientation measurements (b). The computation of the angular distributions in the selected regions of interest (ROI) permits to quantify the fl yaway as shown in Figure 16. Subtracting the histogram of the ROI2 to the histogram of the ROI1 gives the angular distribution of the fl yaway. The distribution is mostly homogeneous across the range of angles, which is translated by an offset of the histogram in the ROI2 compared to the ROI1. However, the distribution of the fl yaway shows a little bump around 10–15 deg, which shows that the fl yaway has a greater tendency to repel from the rest of the hair tress at this orientation in the environmental conditions of the measurement. Single fi ber reso- lution measurement with this technique not only permits to easily detect fl yaway hair, but also to add information by giving the orientation of the fl yaway relatively to the rest of the hair tress. Figure 14. Image of a single hair fi ber in the NIR (a) and its corresponding orientation image (b). Figure 15. Intensity image of three bleached hair tresses (a) and their corresponding orientation measurement (b).
Purchased for the exclusive use of nofirst nolast (unknown)
From: SCC Media Library & Resource Center (library.scconline.org)