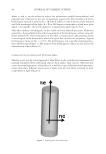
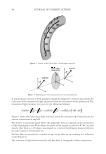
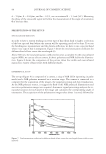
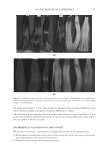
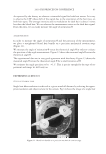
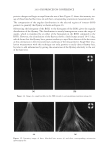
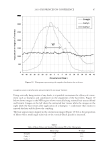
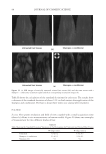
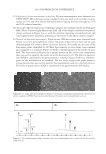
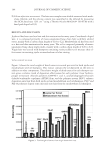
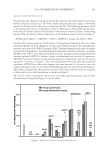
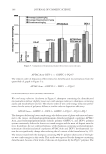
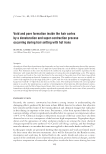
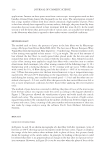
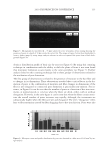
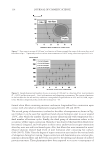
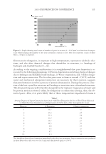
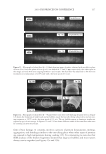
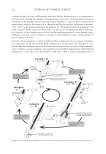
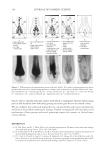
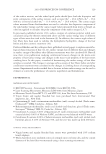
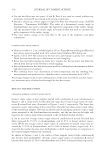
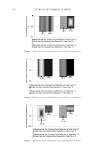
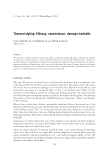
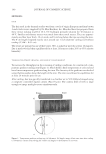
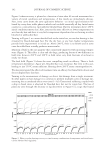
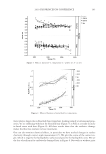
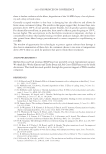
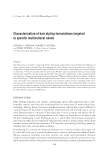
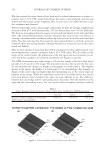
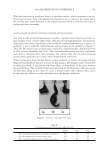
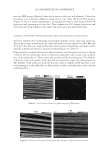
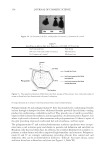
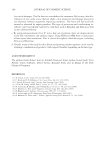
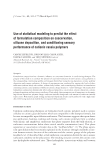
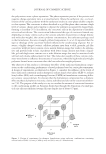
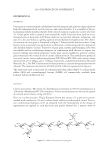
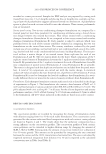
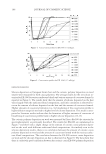
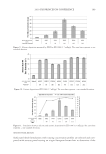
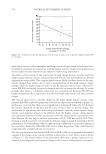
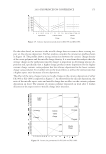
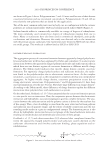
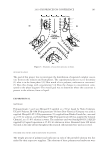
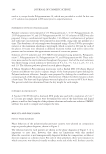
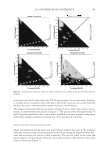
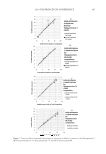
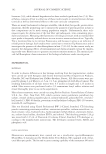
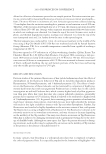
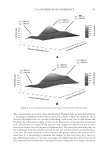
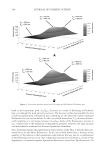
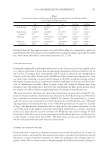
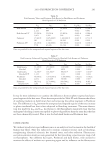
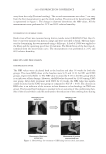
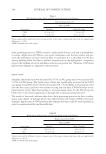
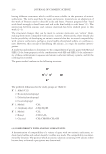
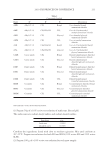
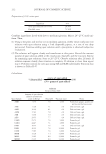
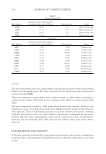
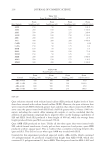
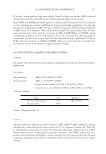
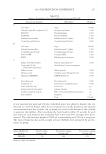
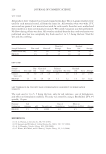
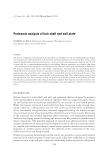
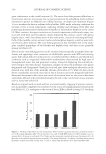
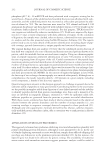
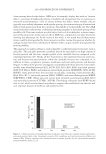
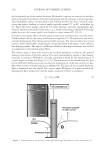
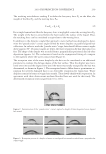
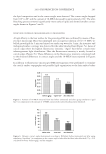
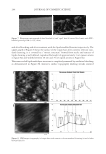
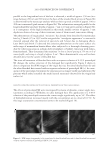
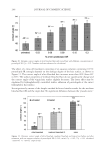
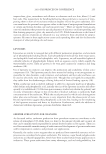
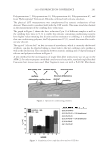
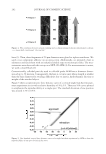
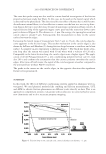
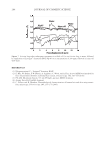
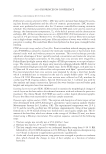
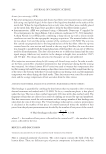
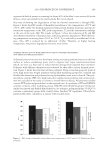
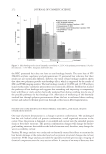
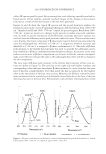
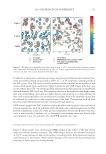
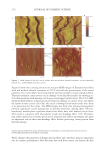
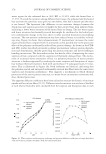
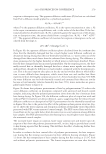
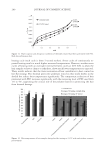
JOURNAL OF COSMETIC SCIENCE 96 MEASUREMENT OF DEGREE OF CURL AND STYLE LONGEVITY In Figure 17 below, three bleached hair tresses with different degrees of curl are imaged (a) intensity and (b) orientation. The computation of the histogram (Figure 18) for each hair tress shows different pat- terns according to the degree of curl. As a matter of fact, as the degree of curl increases (from tress 1 to tress 3), the angular distribution becomes wider (standard deviation increases). The computation of the standard deviation of the histograms (parameter W) shows that the higher the degree of curl is, the greater the W is, as shown in Table I. The angular distribution widens as the degree of curl increases to eventually tend towards a fl at distri- bution for a very high degree of curl. Such analysis can allow the evaluation of the style longevity under high humidity condi- tions for example or allow the classifi cation of tresses according to their degree of curl. Figure 16. (a) Selection of two regions of interest for the center part of the hair tress (ROI 1) and the com- plete image (ROI2), histograms in the respective ROIs (b). Figure 17. Intensity image of three bleached hair tresses (a) and the corresponding orientation (b).

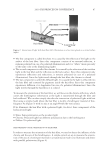
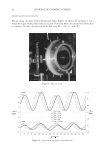
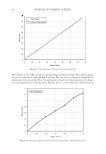
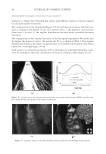
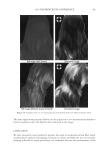
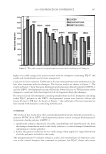
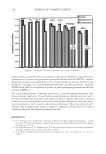
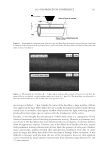
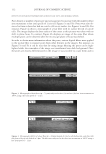
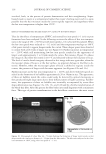
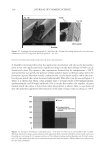
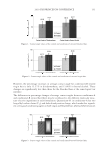
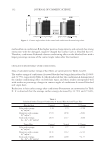
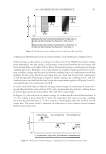
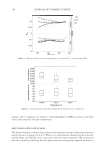
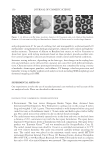
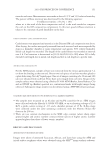
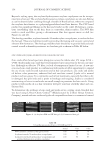
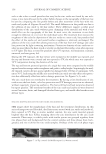
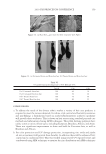
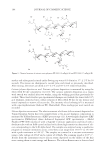
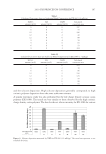
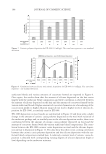
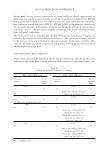
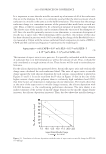
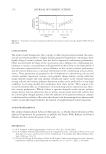
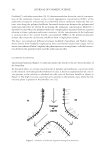
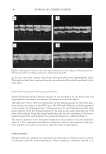
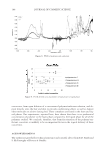
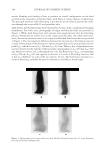
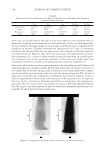
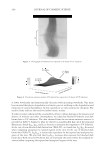
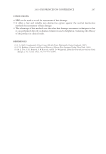
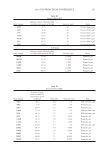
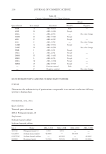
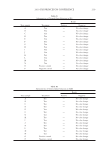
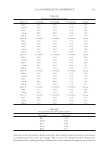
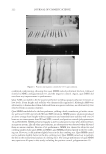
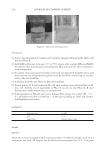
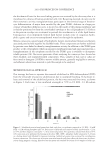
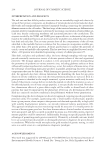
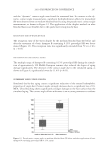
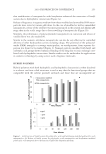
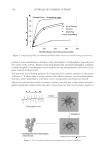
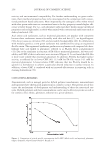
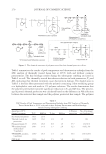
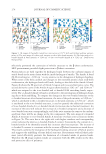
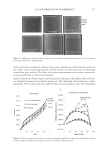
2010 TRI/PRINCETON CONFERENCE 97 SHAMPOO AND CONDITIONER MEASUREMENTS ON HAIR TRESSES Using vertically hung tresses of any shade, it is possible to measure the effi cacy of a treat- ment such as shampoo and conditioner on the alignment of the hair fi bers. Figure 19 below shows images in the NIR region of two vertically hung oriental hair tresses (blond and brown). Images on the left show the untreated hair tresses while the images on the right show the hair tresses after application of a shampoo + conditioner that claims to smooth the hair and facilitate the combing. The hair appears more aligned in the orientation images (Figure 19 (b)) as the proportion of fi bers with a small angle relatively to the vertical (black pixels) is increased. Figure 18. Histograms representing the angular distribution for each tress. Table I Table of Mean Values and Standard Deviations (W) of the Histograms Mean (deg) W (deg) Straight −4.8 13.2 Curly 1 −4.7 19.9 Curly 2 n/a ∞
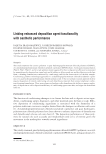
Purchased for the exclusive use of nofirst nolast (unknown)
From: SCC Media Library & Resource Center (library.scconline.org)