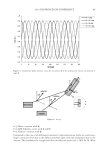
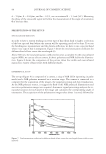
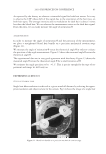
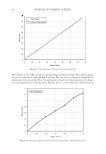
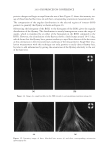
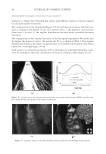
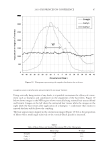
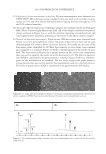
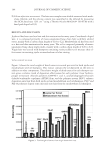
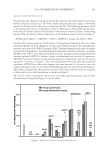
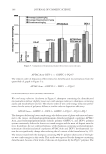
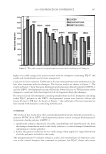
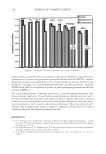
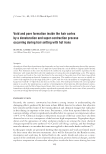
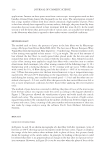
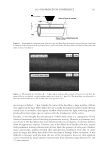
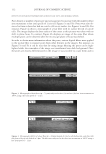
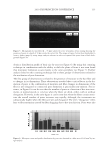
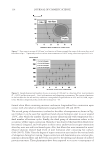
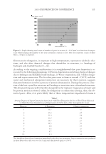
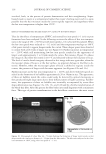
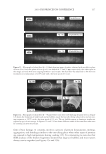
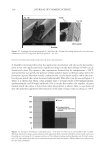
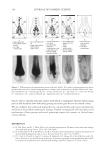
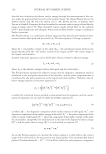
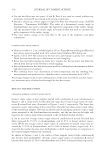
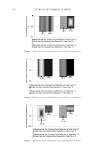
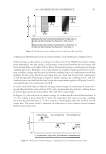
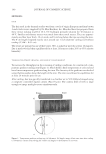
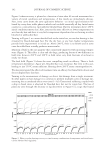
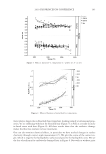
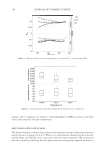
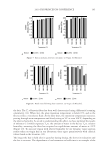
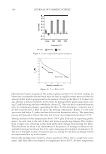
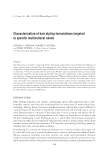
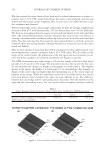
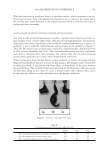
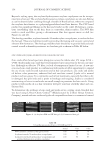
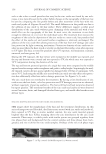
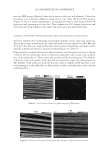
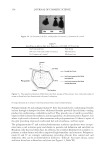
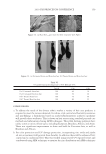
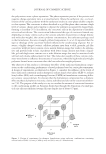
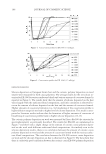
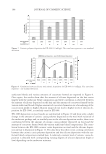
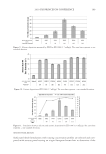
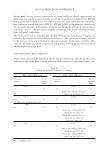
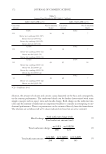
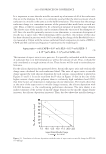
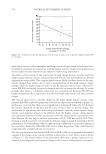
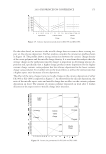
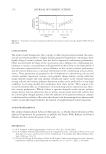
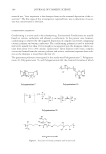
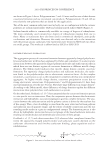
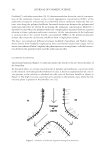
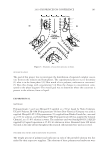
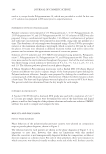
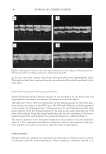
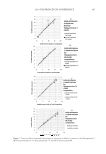
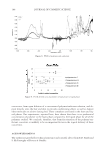
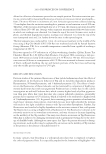
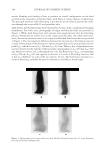
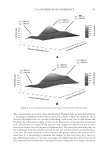
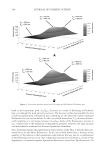
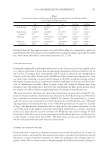
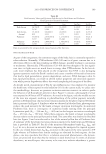
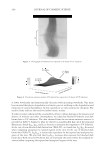
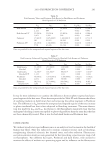
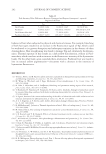
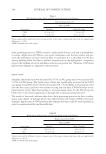
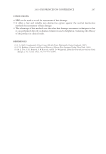
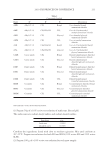
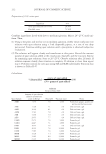
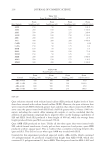
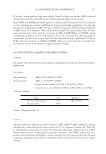
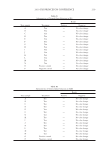
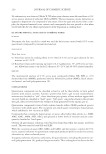
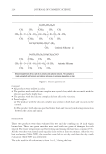
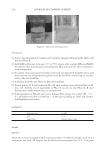
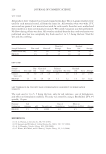
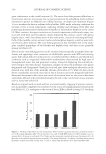
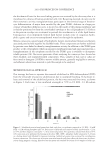
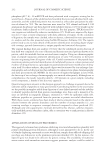
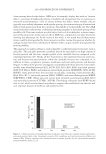
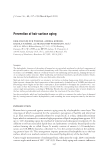
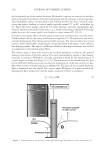
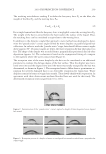
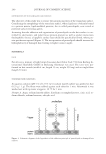
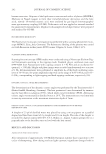
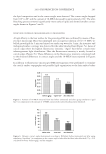
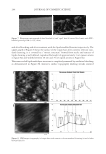
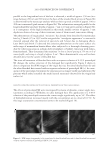
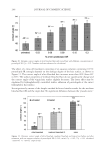
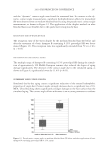
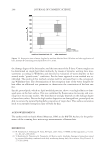
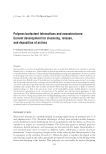
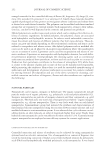
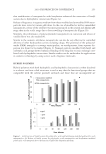
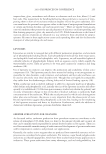
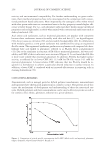
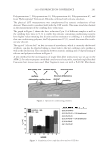
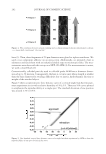
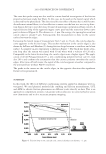
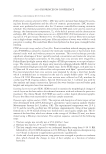
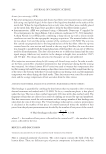
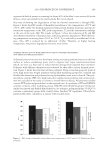
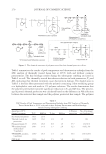
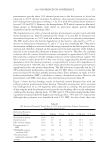
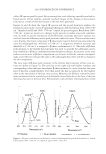
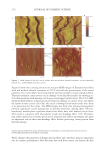
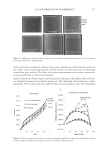
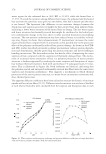
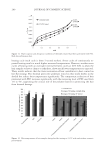
JOURNAL OF COSMETIC SCIENCE 166 DEPOSITION RESULTS Silicone deposition on European brown hair and the cationic polymer deposition on wool swatch were measured for both cassia polymers. The average results for the net silicon in- tensity for EX-906 for various surfactant blends and various amount of coacervate formed is reported in Figure 6. The results show that the amount of silicone deposited on the hair varies largely with the surfactant blend composition, and little correlation is observed be- tween the amount of silicone deposited on the hair and the amount of coacervate formed. Higher amounts of coacervate formation (i.e., by broadening of the coacervation profi le to higher dilution range) do not lead to higher level of silicone deposition. This result is unex- pected as literature results indicate that the formation of higher amounts of coacervate of broadening of coacervation profi les leads to higher silicone deposition (12,13). The cationic polymer deposition on wool was measured by Direct Red 80 dye titration by spectrophotometry as previously described. The results for EX-906 are summarized in Figure 7 and show only a slight change in the amount of cationic cassia polymer depos- ited on the wool with different surfactant blend compositions. As similarly seen in the silicone deposition results, there is no correlation between the amount of cationic cassia polymer deposited on wool and the amount of coacervate formed with the various surfac- tant blend compositions. The correlation between the EX-906 cationic cassia deposition on wool and the silicone deposition on hair is illustrated in Figure 8. The data show that there is a relatively good correlation between the cationic cassia EX-906 polymer deposition Figure 4. Coacervation profi les for EX-906 (3.0 mEq/g). Figure 5. Coacervation profi les for EX-1086 (1.7 mEq/g).

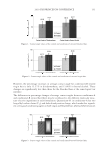
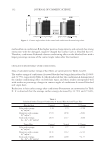
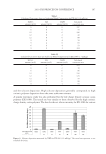
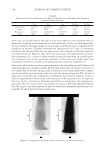
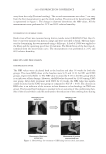
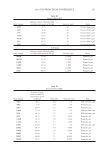
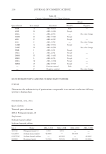
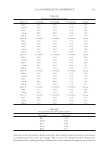
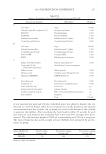
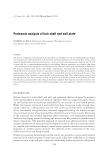
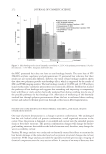
2010 TRI/PRINCETON CONFERENCE 167 and the silicone deposition. High silicone deposition generally corresponds to high cationic polymer deposition from the same surfactant mixture. A similar systematic study was also performed for the low charge density cationic cassia polymer (EX-1086). The trends are very similar to those observed for the high cationic charge density cassia polymer. The data for the net silicon intensity for EX-1086 for various Table I Calculated Coacervate Area per Surfactant Blend Composition for EX-906 (3.0 mEq/g) SLES-3 amount (wt%) SLS amount (wt%) CAPB amount (wt%) Calculated coacervate area 6 0 6 247 6 8 6 55 12 0 6 196 12 8 2 43 12 8 6 88 9 4 4 59 9 4 6 65 6 4 4 53 9 0 4 184 Table II Calculated Coacervate Area per Surfactant Blend Composition for EX-1086 (1.7 mEq/g) SLES-3 amount (wt%) SLS amount (wt%) CAPB amount (wt%) Calculated coacervate area 6 0 6 212 6 8 2 49 6 8 6 86 12 0 2 116 12 0 6 125 12 8 2 55 12 8 6 88 9 4 4 93 Figure 6. Silicone deposition measured by XRF for EX-906 (3.0 mEq/g). The error bars represent ± one standard deviation.
Purchased for the exclusive use of nofirst nolast (unknown)
From: SCC Media Library & Resource Center (library.scconline.org)