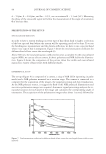
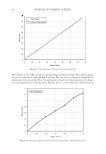
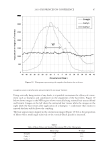
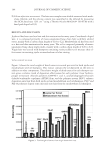
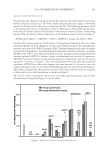
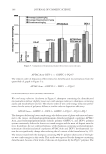
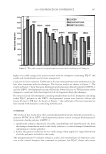
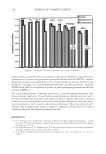
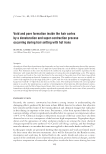
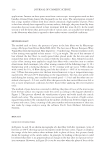
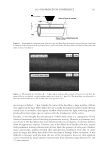
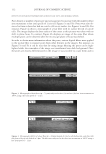
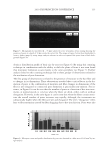
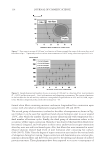
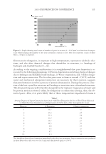
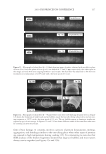
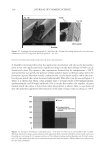
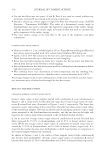
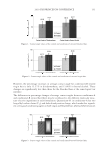
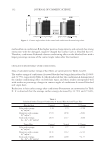
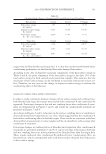
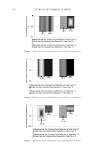
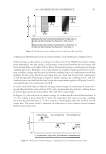
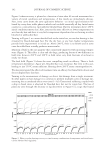
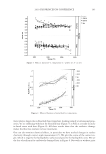
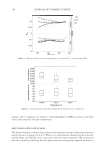
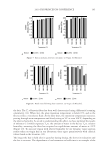
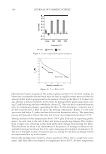
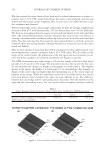
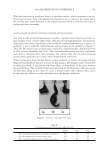
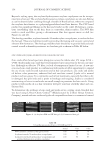
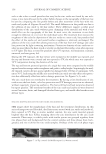
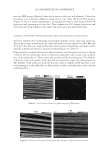
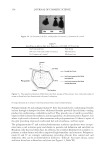
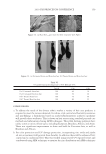
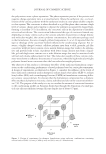
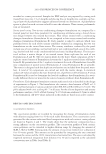
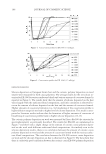
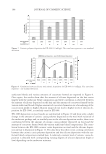
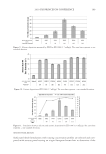
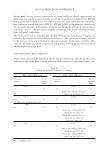
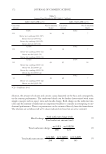
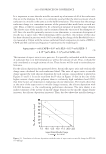
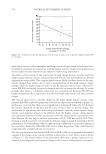
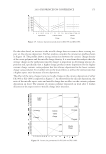
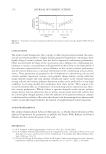
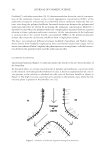
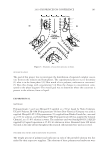
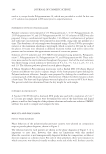
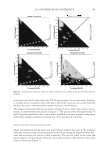
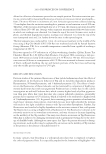
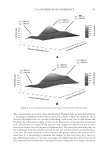
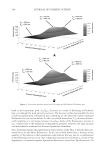
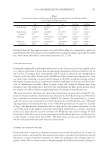
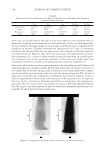
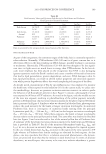
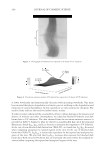
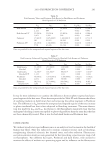
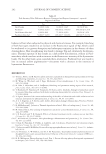
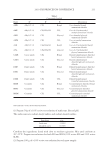
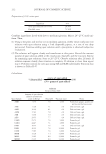
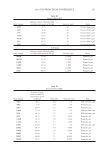
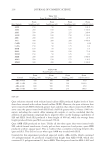
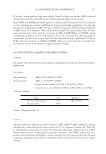
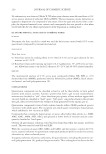
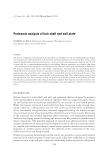
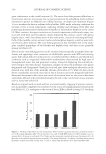
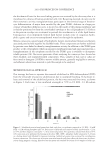
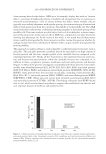
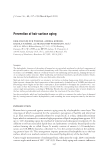
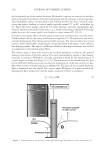
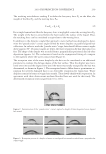
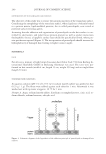
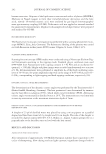
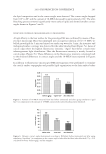
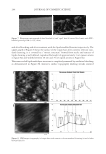
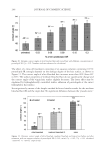
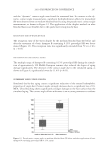
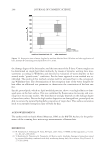
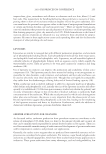
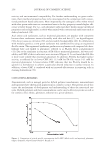
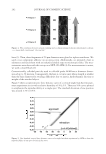
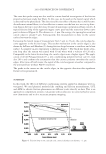
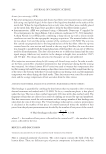
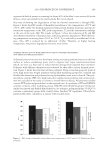
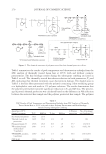
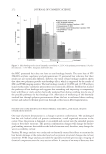
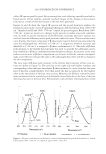
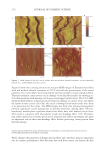
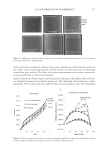
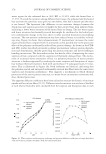
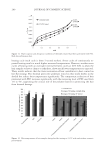
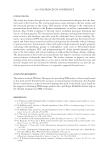
JOURNAL OF COSMETIC SCIENCE 168 surfactant blends and various amounts of coacervate formed are reported in Figure 9. Once again, the results show that the amount of silicone deposited on the hair varies largely with the surfactant blend composition and little correlation is observed between the amount of silicone deposited on the hair and the amount of coacervate formed by the various surfactant blends. Higher amounts of coacervate formation (or a broadening of the coacervation profi le to higher dilution range) do not lead to higher levels of silicone de- position for EX-1086, as similarly seen for EX-906. EX-1086 deposition on wool results are summarized in Figure 10 and show only a slight change in the amount of cationic cassia polymer deposited on the wool with variation of the surfactant package and, as similarly seen in the silicone deposition results, there is no correlation between the amount of cationic cassia polymer deposited on wool and the amount of coacervate formed with the various surfactant blend compositions. The corre- lation between the EX-1086 cationic cassia deposition on wool and the silicone deposi- tion on hair is illustrated in Figure 11. The data show that there is not a strong correlation between the cationic cassia polymer deposition and the silicone deposition with the sur- factant blend compositions studied here. A relatively constant level of cationic cassia de- position is obtained with corresponding varying degrees of silicone deposition (high or low) depending on the surfactant mixtures. Figure 7. Cationic polymer deposition for EX-906 (3.0 mEq/g). The error bars represent ± one standard deviation. Figure 8. Correlation between silicone and cationic deposition for EX-906 (3.0 mEq/g). The error bars represent ± one standard deviation.

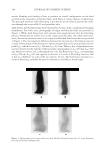
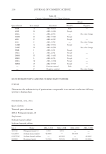
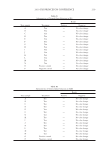
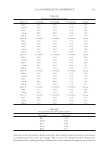
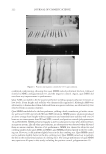
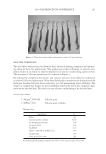
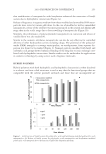
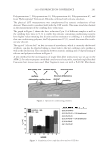
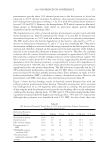
2010 TRI/PRINCETON CONFERENCE 169 SENSORY PANEL RESULTS Surfactant blend formulations with varying coacervation profi les are selected and com- pared with sensory panel testing on virgin European brown hair to determine if the Figure 9. Silicone deposition measured by XRF for EX-1086 (1.7 mEq/g). The error bars represent ± one standard devation. Figure 10. Cationic deposition of EX-1086 (1.7 mEq/g). The error bars represent ± one standard deviation. Figure 11. Correlation between silicone and cationic deposition for EX-1086 (1.7 mEq/g). The error bars represent ± one standard deviation.
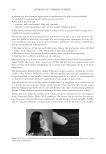
Purchased for the exclusive use of nofirst nolast (unknown)
From: SCC Media Library & Resource Center (library.scconline.org)