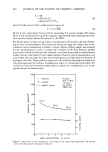
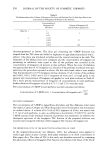
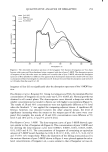
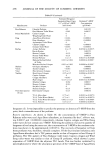
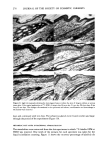
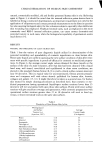
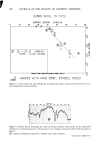
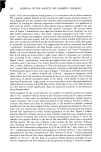
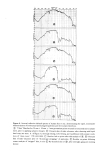
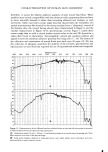
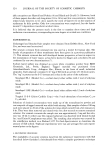
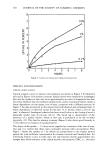
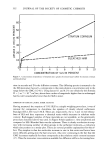
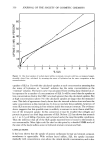
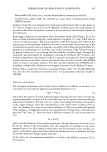
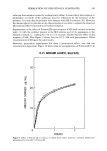
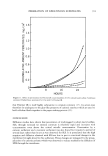
PERMEATION OF KERATINOUS SUBSTRATES 345 As a preliminary it may be noted that considerable barrier strength does exist in the stratum corneum against nonionic and cationic surfactants. Thus the cationic, myristyl- dimethylbenzyl ammonium chloride (Barquat MS-100) applied at the level of 10% to neonatal rat stratum corneum requires about six days for penetration. Figure 5 shows the permeability curve, which resembles the schematic of Figure 2. Using eq 1 above, one can calculate from the slope an apparent permeability, P, of 2.2 x 10 -6 cm/sec, and from the lag time of six days D = 0.8 x 10 -• cmg/sec. The permeability value is un- reasonably high since it is even greater than that for water (see above). If one now uses these values of P and D in eq 3 to calculate the partition coefficient K, a value of 1380 is obtained. For the surfactant concentration of about 0.1 g/cm a this implies a concentration of 138 g/cm a of Barquat MS-100 in the swollen skin, a physical impossi- bility. It is plausible that sometime between three and six days the membrane has been structurally altered to permit such a high permeation. Since this change may well be non-uniform throughout the membrane, there is little point in the calculation of P or D in such a case. The same phenomenon was found for the nonionic Tergitol 15-S-9 at m- z o 80 70 60- 40- 30- 20- 10- ß 6 8 DAYS 0 2 4 10 12 Figure 5. Permeability of Barquat MS- 100 at 10% concentration 14

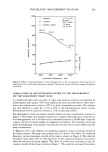
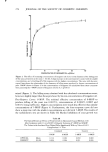
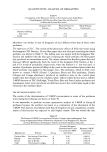
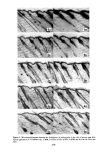
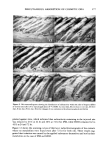
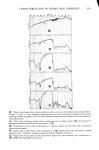
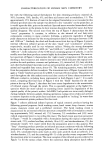
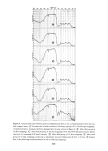
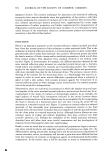
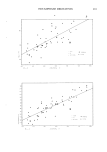
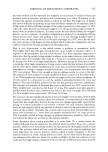
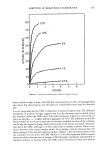
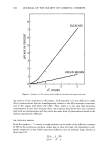
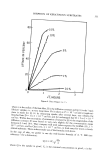
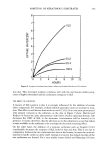
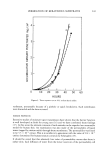
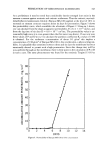
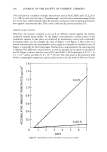
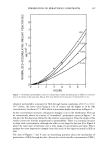
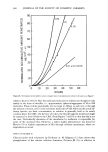
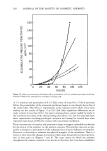
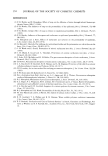
346 JOURNAL OF THE SOCIETY OF COSMETIC CHEMISTS 10% and also for a number of simple electrolytes such as NaCI, RbCI and CaCI2, all at 1 to 2 M. In each case the lag or "breakthrough" times for these materials ranged from two to six days, which indicates that the stratum corneum provides a fairly good barrier even against concentrated salts. This is also confirmed by previous studies (18). SODIUM LAURYL SULFATE However, the stratum corneum is not such an effective barrier against the anionic surfactant sodium lauryl sulfate. At the higher concentrations a steady attack on the membrane appears to take place as evidenced by permeation curves with continually increasing slope see for example the data of Figure 3 and Figure 4. But at the very lowest concentrations the permeability curves begin to resemble the idealized curve of Figure 2, especially for the initial stages. Furthermore, approximately the same lag time is obtained for different concentrations, so that an attempt can be made to calculate P and D. Figure 6 shows data for runs at 0.01 and 0.001% SLS which give a P of 1.7 to 2.3 x 10 -8 cm/sec and aD of 1.0 x 10 -•ø cm2/sec. The only study in the literature with which a meaningful comparison can be made seems to be the work of Howes (10) he 1.6 0.01% 0.001% I I I 0 1 2 3 4 5 6 DAYS Figure 6. Permeability of 0.01 and 0.001% sodium lauryl sulfate
Purchased for the exclusive use of nofirst nolast (unknown)
From: SCC Media Library & Resource Center (library.scconline.org)