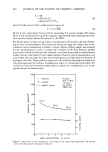
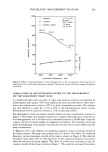
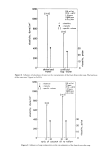
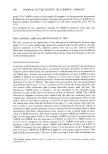
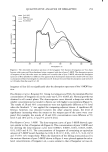
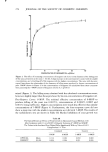
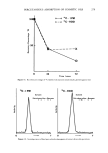
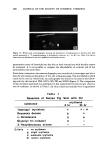
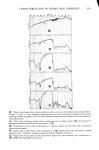
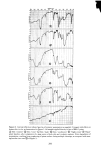
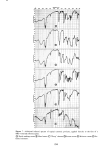
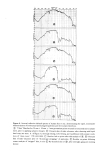
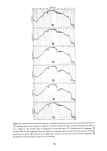
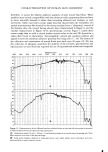
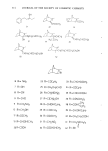
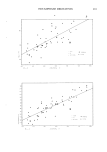
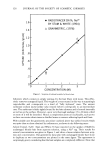
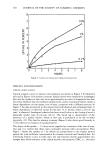
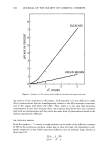
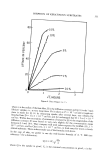
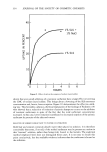
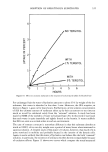
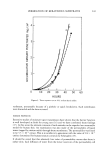
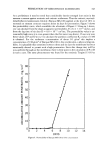
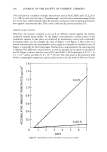
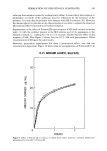
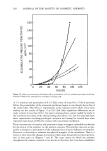
294 JOURNAL OF THE SOCIETY OF COSMETIC CHEMISTS depth" of the electromagnetic sensing waves, is a consequence of use of the cosmetics. The cosmetics applied assisted in the removal of rough, loosely attached stratum cor- neum fragments and also improved the refractive index matching across the prism/skin interface by leaving the residual components of the formulations. It is significant to note, here, as will be confirmed in later figures, that no apparent change in the skin "moisture" level i• demonstrated after this cosmetic treatment. The second lowest trace of Figure 5 characterizes once again the forearm skin of our volunteer, but now after further treatments with a "skin mask" cosmetic preparation and a skin "condi- tioner" (according to the suppliers' instructions for the intended use of these products). This infrared spectrum reveals, with the exception of some residual hydrocarbon and fatty-ester components imbibed into the epidermal layers, the return of the skin quality to, essentially, its pretreated state. This suggests that the polyol-containing"mask" and "conditioner" formulations did little besides remove excess hydrocarbon and (seem- ingly weakened) epidermal layers affected by the "cleanser" and "toner" formulations. Finally, the lowest infrared spectrum included in Figure 5 characterizes the forearm skin of our subject as treated with a "night cream" after its "cleansing" and "condition- ing" according to the cosmetic supplier's instructions. As the spectra collected in Figure 6 show, "moisturizing" cream has the highest fatty-ester content of ahy of the cosmetics used in this series. It is, in fact, these fatty esters which are taken up into the skin to soften, lubricate, or plasticize it. The only indication of a truly increased "mois- ture" content (that is, additional water retention) of the skin is the slight skewing of the N-H absorption band in the lowest trace of Figure 5. This band, normally symmetrical about 3300 cm -•, is shifted towards the 3400-cm -• absorption maximum which characterizes the O-H resonance of retained hydroxyl or water groups. The continued observation of intense absorption bands in the Amide I and Amide II region of the spectrum illustrates the "night cream" to have been taken up into the epidermal layers rather than to be lying in a thin film above them. In the latter case, even a film thickness of a few microns would significantly damp the analytical sensitivity to proteinaceous layers beneath them. Some judgment of the actual influence of a number of cosmetic products on human skin in situ, examined without distress to the volunteer subject and in a rapid, noninva- sive manner, is thus easily accomplished by the internal reflection, infrared spectro- scopic technique. The second important feature of the method, beyond its ability to evaluate skin before and after its modification, is the method's suitability (without modification) for the direct analysis of the cosmetic preparations themselves. The tech- nique does not require their dilution, extraction, or complex processing in any manner beyond that experienced in their normal application to the skin. Figure 6 collects internal reflection, infrared spectra of neat cosmetic preparations (as supplied and ap- plied directly to human skin with the outcome characterized in Figure 5). All of the samples were applied directly to the face of the same KRS-5 prism used in recording the skin spectra. The top trace of Figure 6 characterizes the skin "cleanser" formula- tion. Scanning from left to right across this trace, it is seen that the major infrared bands are for hydrocarbon components at 2950 and 2850 cm-• fatty esters, at 1740 cm-• confirming absorptions for hydrocarbons at 1470 and 1380 cm-• and confirming absorptions for the ester components at 1280, 1180 and 1130 cm -•. A final confirming absorption band for the long chain, aliphatic hydrocarbons present in this formulation appears at 740 cm -•. On the basis of numerous similar analyses, primarily of pure known compounds and their mixtures, the top spectrum in Figure 6 would be compati-

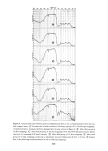
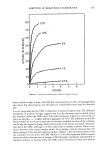
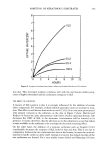
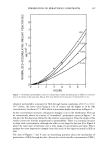
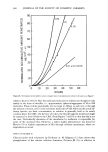
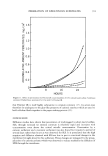
CHARACTERIZATION OF HUMAN SKIN CHEMISTRY 295 ble with the following typical formulation for skin cleansing products: mineral oil, 50% beeswax, 10% lanolin, 4% and fatty acid esters used as emulsifiers, 1%. The approximately 35% fraction of water in the original formulation is not revealed in this infrared spectrum since the sample was allowed to dry "naturally" on the prism face, as it would upon the skin, prior to the analysis. Spectral traces recorded immediately after applying cosmetics to the prisms do show intense absorption bands for water, but these quickly disappear. The second trace from the top of Figure 6 characterizes the skin "toner" preparation. It contains, in addition to the mineral oil and fatty-ester components common to many cosmetic formulas, a polymeric ingredient of highly polar character as indicated by the strong absorption band in the region between 1100 and 1200 cm -•. Similarly, the third and fourth traces from the top of Figure 6 present internal reflection infrared spectra of the skin "mask" and "conditioner" products, respectively, actually used by our volunteer subject. Noting the strong absorption bands in the regions between 3000 cm -• and 3600 cm -•, and between 1000 cm -• and 1200 cm -•, both indicative of the O-H bond containing groups of polyols, it can be readily seen that these products contain highly hydroxylated components. The next-to- last spectrum of Figure 6 characterizes the "night cream" preparation which was used, showing a band sequence and relative intensity ratio which indicates this typical com- position for such products: stearates and palmitates, 3% mineral oil, 3% fatty alcohols and other hydroxylated materials (such as polypropylene glycol), about 5% and both animal and vegetable fatty esters, about 6%. The remaining quantity, water, had dried from the prepar,ation before its analysis. The lowermost trace of Figure 6 presents once again a "blank" baseline spectrum for a KRS-5 internal reflection prism. This prism was used throughout the skin analysis series and also a series of direct characterizations of different cosmetics, including those represented in both Figures 6 and 7. It is easily noted, comparing this final trace of Figure 6 with the "blank" baseline for the same prism at the top of Figure 5, that there has been some degradation in the transmission of infrared energy through the prism. This is especially apparent at the higher fre- quencies which are more subject to scattering losses caused by degradation of the optical quality of the prism's surface. Soft KRS-5 salt prisms are more easily damaged during multiple, between-sample cleaning operations (using cotton swabs and acetone to remove deposits on the prism face) and more susceptible to "etching" by water than are the germanium prisms preferred for this work. Figure 7 collects additional infrared spectra of typical cosmetic products having the following general purposes: facial washing cream, hand cream, deep cleanser, suntan cream, moisture cream and a perfumed ointment. The facial washing cream is characterized by an internal reflection spectrum compatible with a formulation contain- ing approximately 50% mineral oil, 15% beeswax, 5% emulsifiers and 30% water (which evaporated prior to recording this trace). The hand cream spectrum presented in Figure 7 would be compatible with a formulation having this typical composition: stearic acid, 15% sorbitol and fatty alcohols, 10 to 12% and triethanolamine, 2% the remainder (nearly 72% water) dried from the preparation prior to this analysis. The "deep" cleansing product provides an infrared spectrum consistent with the following proportion of ingredients: isopropylpalmitate, 2 % saturated fatty acids (such as stearic acid), 2% unsaturated fatty acids (such as oleic acid) polyols (such as sorbitol), 2% triethanolamine, 1% and the remaining 80+ % of the product water evaporated from the specimen prior to its analysis. The most complex of the infrared spectra collected in Figure 7 is for the suntan cream, where the numerous sharp absorption bands reflect
Purchased for the exclusive use of nofirst nolast (unknown)
From: SCC Media Library & Resource Center (library.scconline.org)