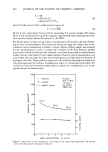
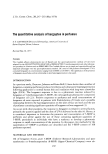
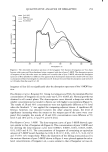
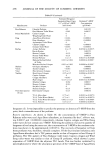
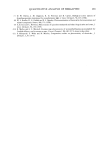
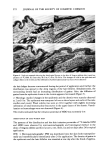
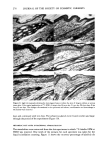
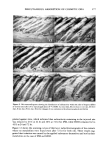
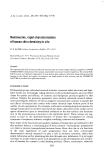
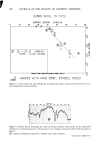
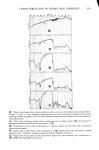
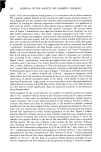
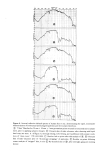
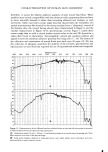
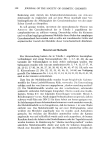
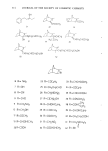
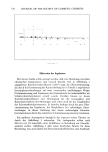
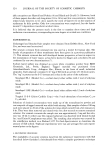
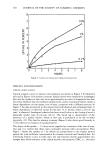
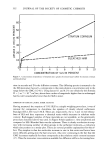
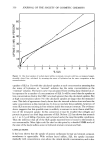
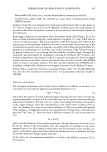
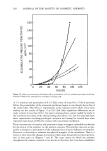
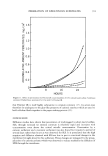
252 JOURNAL OF THE SOCIETY OF COSMETIC CHEMISTS BERGAMOT OIL YVES ST. LAURENT TOILET WATER Solvent front .., Origin 5 Figure 1. Thin layer chromatogram showing 1% bergamot oil in ethanol and Yves Saint Laurent toilet water as observed under UVA illumination. The perfume shows six main fractions, five of which are similar to those of bergamot oil. Band 4 is 5-MOP (Figure 1). The bergapten TLC band of these perfumes was adequately separated from the adjacent TLC bands and had a yellowish-green fluorescence similar to that of the 5-MOP fraction of bergamot oil. However, the fluorescence of the 5-MOP band of this group of perfumes and of bergamot oil was not as bright and clear as that of pure 5-MOP. Perfumes belonging to Group B (e.g., Brut aftershave), which formed the larger portion of the perfumes tested, had more than five to six main fractions and the 5-MOP band of most of these perfumes did not show a good separation from the ad- jacent bands and had a dull yellowish fluorescence indicating the presence of im- purities. This was further confirmed by the absorption spectrum which was different from that of pure 5-MOP (Figure 2). Steam distillation, which was used in Cieri's method, was carried out to separate the steam-volatile portion of the perfume and

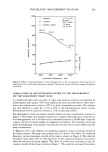
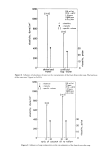
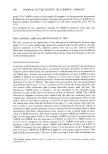
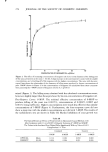
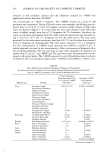
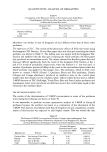
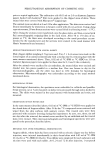
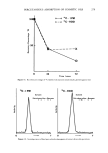
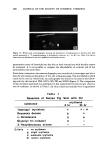
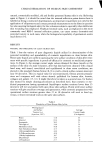
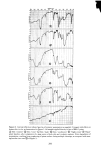
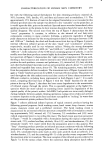
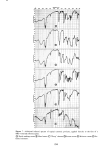
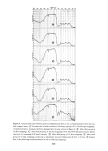
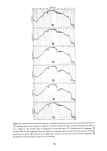
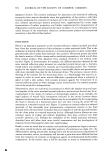
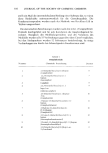
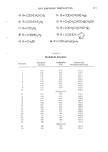
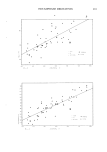
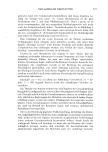
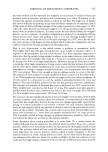
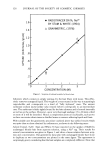
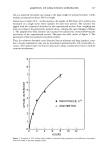
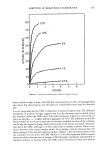
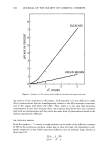
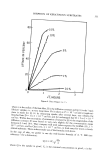
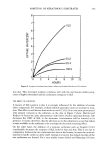
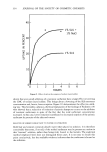
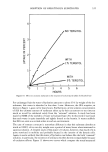
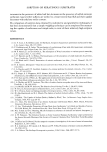
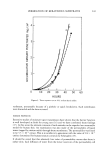
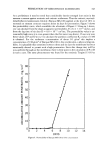
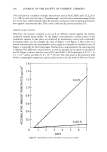
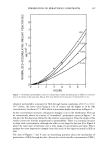
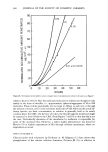
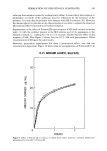
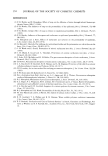
QUANTITATIVE ANALYSIS OF BERGAPTEN 253 0.20- Pure 5-MOP Bergamot off Y.S.L. Todet water Brut aftershave 0.18. 0.16. 0.14. • 0.12. _ • 0.10, • 0.08, 0.06, 0.02. 0 i i i I i i 225 250 275 300 325 350 400 WAVELENGTH nm Figure 2. The ultraviolet absorption spectrum of the bergapten TLC fraction of bergamot oil, Yves Saint Laurent toilet water and Brut aftershave lotion compared with that of pure 5-MOP. The absorption spectra of bergamot oil and the toilet water are similar and resemble that of pure 5-MOP, whereas the absorption spectrum of Brut aftershave is different. The apparent lack of absorption characteristics below 240 nm is due to absorption of these wavelengths by chloroform itself. It should be noted that the absorption scale is from 0 to 0.20 rather than the usual 0 to 1.00 bergamot oil but did not significantly alter the absorption spectrum of the 5-MOP frac- tion. Dose-Response Curves.' Bergamot Oil. Using 2/xl aliquots and TLC, the minimal effective concentration of bergamot oil on the yeast was 0.25% (0.005/xl). Normal growth was obtained in all control plates. The dose-response curve showed a sharp rise with the smaller concentrations but tended to flatten out with higher concentrations (Figure 3). The results of 20 and 40% concentrations were not significantly different at 5% level when the Student's "t" was applied for comparing adjacent means. A significant dif- ference, however, was obtained between the other adjacent means, the level of significance increasing when the means on the steeper part of the curve were com- pared. For example, the results of 10 and 20% concentrations were different at 5% level: 5 and 10% at 1% 2.5 and 5% at 0.1% level. Dose-Response Curves.' 5-MOP. The dose-response curve of pure 5-MOP showed a pat- tern similar to that of bergamot oil (Figure 4). The concentrations of pure 5-MOP used for deriving the dose-response curve were 0.00025, 0.0005, 0.001, 0.0025, 0.005, 0.01, 0.025 and 0.1%. The concentrations of bergamot oil containing an equivalent amount of 5-MOP would therefore be 0.09, 0.19, 0.37, 0.93, 1.85, 3.71, 9.26, 18.52 and 37.04% (v/v) respectively. When the diameters of the killing zones produced by the various dilutions of pure 5-MOP shown in Figure 4 were plotted against the calcu- lated concentrations of bergamot oil, a curve similar to that of bergamot oil was oh-
Purchased for the exclusive use of nofirst nolast (unknown)
From: SCC Media Library & Resource Center (library.scconline.org)