230 jOURNAL OF THE SOCIETY OF COSMETIC CHEMISTS of racial differences in conductance, TEWL, and biomechanical properties in sun- protected and non-sun-exposed areas of the skin have shown that water content, ex- tensibility, recovery, and elastic modulus are higher for blacks in sun-exposed areas as compared to whites (10). With regard to physiologic differences, the literature presents a confusing picture. The present study was undertaken in order to gain a better understanding of the fundamental differences between black and white skin. MATERIALS AND METHODS SUBJECTS Thirty black and thirty white subjects were enrolled. Each group consisted of age- matched women between the ages of 18 and 45. Informed consent was obtained from all subjects. The participants used Dove © soap and refrained from using cosmetics, lotions, and antibacterial soaps 48 hours before the study and throughout the duration of the study. SEASON AND LOCATION The study was conducted in Cincinnati, Ohio, over a six week-period in winter from December through February, when temperatures and relative humidity are low and the frequency of dry skin (winter xerosis) is high. Approximately five age-matched black and white subjects were evaluated each week. SCREENING PHASE We selected subjects who represented opposite poles in skin pigmentation: very dark blacks versus light-skinned whites. The Minolta Chroma Meter (Minolta Camera Co., Ltd., Osaka, Japan) was used to obtain L* values on the upper inner arms, according to the Commission Internationale de l'Eclairage (CIE) system in which L* represents the level of brightness or luminescence (! 1). A low L* value indicates low reflectance of light (higher absorption). We screened about 45 subjects per group to select 30 blacks with the lowest L* values and 30 whites with the highest L* values. STUDIES The subjects were equilibrated for 30 minutes in an environmentally controlled room before measurements. The temperature ranged between 19 and 22øC, and the relative humidity varied between 25 and 36%. An area of 6.25 cm 2 was delineated on the left and right medial cheeks, mid-volar forearms, and lateral mid-lower legs. Transepidermal water loss TEWL (g/m2/h) was measured using the Servo-Med © Evaporimeter EP1 (Servo-Med, Stockholm, Sweden). Two measurements were made at each site and averaged.

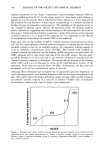
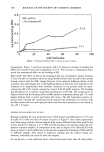
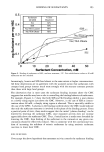
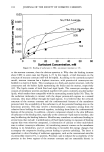
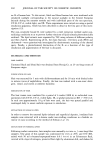
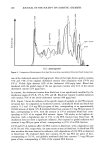
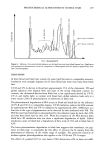
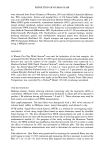
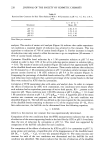
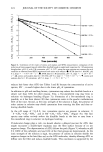
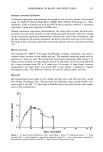
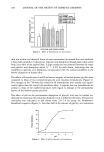
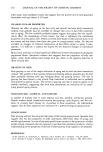
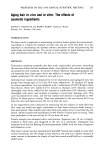
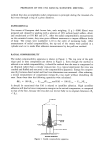
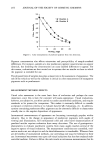
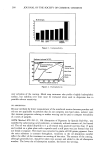
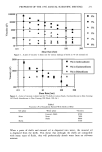
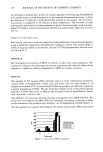
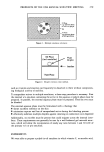
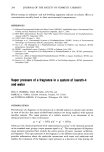
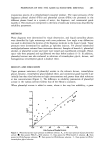
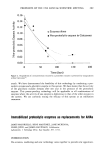
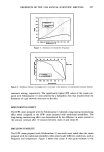
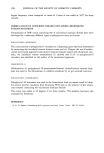
COMPARISON OF BLACK AND WHITE SKIN 231 Stratum corneum hydration Continuous capacitance measurements were made at each site for a period of 60 seconds using the NOVA © Dermal Phase Meter (DPM) 9003 (NOVA Technology Co., Mas- sachusetts, USA) in conjunction with the NOVA data acquisition software. Continuous capacitance values were expressed in DPM units. During continuous capacitance measurements, the probe head occludes the skin mea- surement site and values increase as water builds up under the probe. The first reading in the continuous capacitance measurement indicates the initial level of hydration, and the last reading (at 60 seconds) represents the level of moisture built up in 60 seconds. The slope of the continuous capacitance recordings indicates the rate of moisture buildup (12). Elastic recovery The Cutometer ©, SEM 474 (Courage and Khazaka, Cologne, Germany), was used to evaluate elastic recovery on the cheeks and legs. The standard measuring probe with an aperture of 2 mm was used. We utilized the stress/strain measuring mode (mode 2) in which suction pressure increases linearly from 0 to 200 mbar over 10 seconds followed by a linear decrease from 200 to 0 mbar over 10 seconds. A final elastic recovery measurement was made when the pressure fell to zero. Figure 1 illustrates a typical deformation curve. The difference between R0 and R4 reflects elastic recovery. Skin pH pH measurements were made on the cheeks and legs with a flat pH electrode, model 955 (Fisher, Pittsburgh, PA). The electrode was calibrated using standard buffer solu- tions at pH 4 and pH 7.0. One drop of distilled water was placed on the skin surface prior to the measurement. R0 o •'o •'o •o t • 20 30 Time (seconds) Figure 1. A typical elastic deformation curve using Mode 2 where: E = Amplitude (mm) t = Time (seconds) R0 = total deformation, expressed as amplitude (mm) R3 = elastic deformation, expressed in mm when the vacuum reaches 0 and R4 = elastic recovery when suction ceases.
Purchased for the exclusive use of nofirst nolast (unknown)
From: SCC Media Library & Resource Center (library.scconline.org)