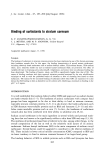
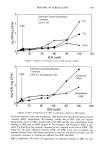
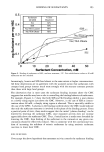
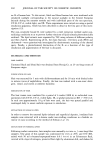
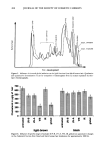
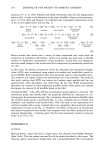
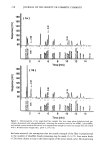
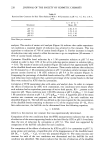
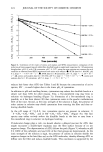
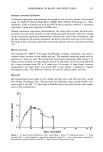
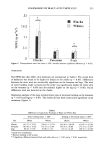
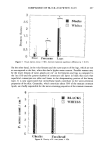
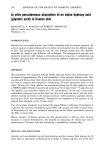
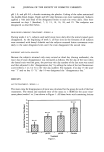
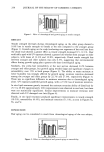
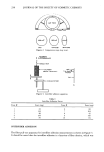
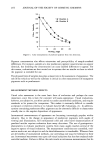
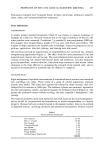
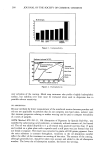
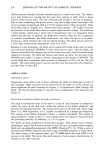
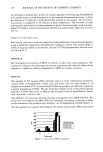
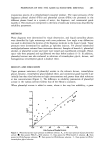
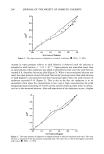
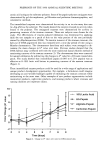
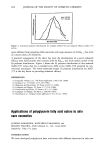
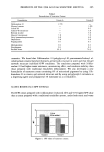
COMPARISON OF BLACK AND WHITE SKIN 233 22 16.5 11 [' 5.5 0 Cheeks Blacks Whites Forearms Legs Figure 2. Transepidermal water loss (mean + SD). Asterisk indicates significant difference (p 0.05). HYDRATION The DPM data that reflect skin hydration are summarized in Table I. The initial level of hydration was found to be higher for blacks on the cheeks (p 0.05). Differences between the races were not statistically significant on the forearms and legs. The level of water buildup under occlusion by the probe was significantly higher for white skin on the forearms (p 0.05) and directionally higher on the legs (p 0.06). Racial differences were not detected on the cheeks. Regression analysis of the slope revealed lower rates of moisture buildup on the forearms (p 0.05) and legs (p 0.05). The cheeks did not show statistically significant racial variations (Figure 3). Table I Differences in Capacitance Readings of Black and White Skin Initial reading (mean + SD) a Reading at 60 seconds (mean + SD) b Site Blacks Whites Blacks Whites Cheeks 141.37 + 25.55 119.03 + 23.72* 454.20 + 148.58 413.87 + 153.81 Forearms 107.60 + 15.62 115.53 + 21.64 144.33 + 46.86 175.13 + 72.55* Legs 96.43 + 6.59 97.80 + 7.27 113.4 + 21.49 130.33 + 35.19+ Initial level of hydration. Moisture buildup in 60 seconds. *,+ Significant difference between black and white skin at p 0.05 and p 0.06, respectively.

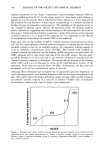
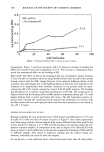
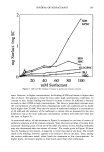
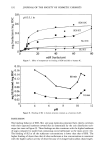
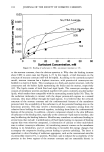
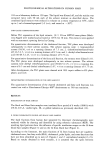
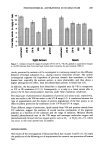
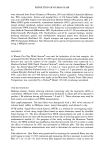
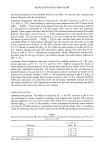
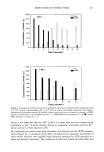
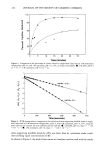
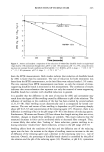
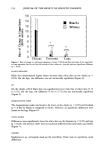
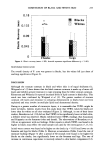
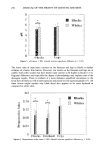
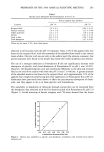
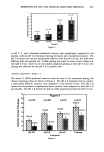
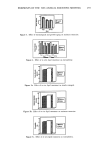
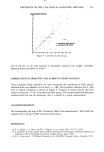
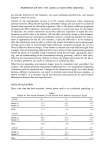
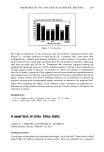
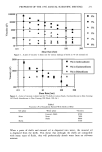
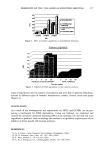
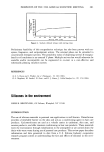
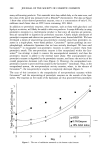
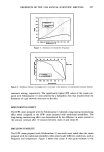
234 JOURNAL OF THE SOCIETY OF COSMETIC CHEMISTS 16 ?- õ 8 • 4 o :..,:: .• : ::.: • ß :.: : • Cheeks Forearms Legs Blacks Whites Figure 3. Rate of change in continuous capacitance (mean + SD) found from the slope of the capacitance vs time regression line for the first 60 seconds of data collection. Asterisk indicates significant difference (p 0.05). ELASTIC RECOVERY Black skin demonstrated higher elastic recovery than white skin on the cheeks (p 0.05). On the legs, the difference was not statistically significant (Figure 4). pH On the cheeks, pH of black skin was significantly lower than that of white skin (5.15 vs 5.52). On the legs, the difference (5.56 vs 5.75) was not statistically significant (Figure 5). DESQUAMATION INDEX The desquamation index was found to be lower on the cheeks (p 0.05) and forehead (p 0.05) for blacks as compared to whites. However, no significant differences were found on the legs (Figure 6). VISUAL SCORES Differences were significantly lower for white skin on the forearms (p 0.05) and legs (p 0.05). On the face, there were no statistical differences between blacks and whites (Figure 7). AEROBES Staphylococci sp. principally made up the microflora. There were no significant racial differences.
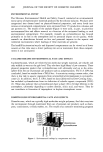
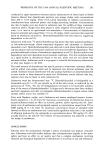
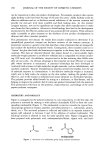
Purchased for the exclusive use of nofirst nolast (unknown)
From: SCC Media Library & Resource Center (library.scconline.org)