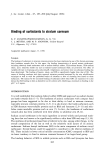
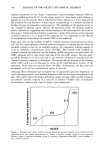
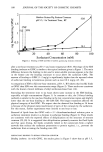
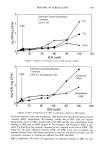
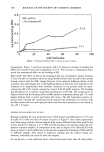
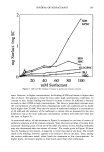
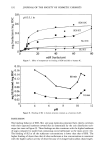
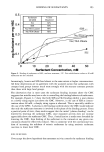
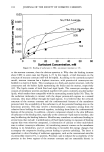
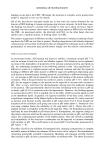
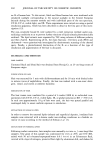
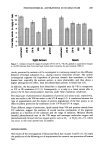
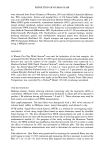
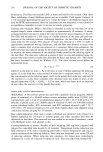
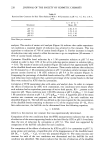
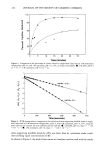
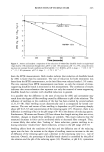
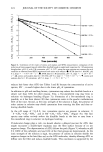
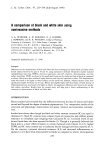
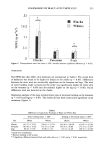
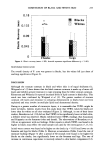
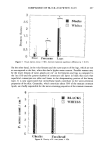
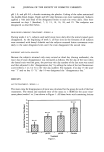
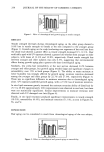
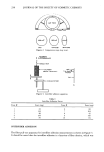
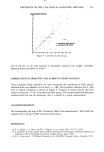
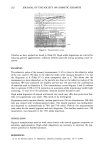
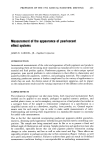
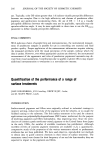
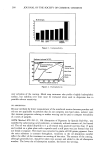
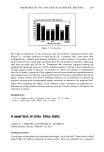
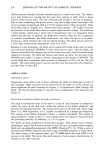
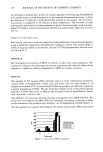
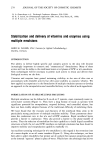
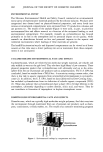
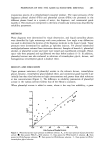
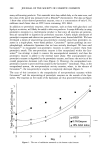
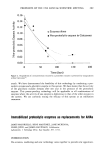
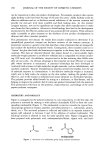
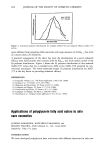
COMPARISON OF BLACK AND WHITE SKIN 235 0.18 0.135 0.09 0.045 0 Cheeks Blacks Whites Legs Figure 4. Elastic recovery (mean - SD). Asterisk represents significant difference (p 0.05). PROPIONIBACTERUM ACNES The overall density of P. acnes was greater in blacks, but the values fell just short of reaching significance (Figure 8). DISCUSSION Although the stratum corneum in black and white skin is of equal thickness (1), Weigand et al. (2) have shown that the black stratum corneum is made up of more cell layers and exhibits greater resistance to tape stripping than the white stratum corneum. Rienertson and Wheatly (3) reported increased levels of lipid content in black skin. This result was later confirmed by Weigand et al. (2). The greater number of stratum corneum cell layers and resistance to stripping demonstrated in blacks have not been explained and may involve intercellular lipids and desmosomal density. Owing to a greater number of corneocyte layers, it is reasonable that TEWL might be lower in blacks. Indeed, results from this study show that TEWL values for blacks are lower than for whites on all sites evaluated (Figure 2). Although, in one of their latest studies, Berardesca et al. (10) did not find TEWL to be significantly lower in black skin, a definite trend was observed. Blacks exhibited lower TEWL readings than Caucasians and Hispanics on the forearms (volar and dorsal). The observations of Berardesca et al. (10) are in agreement with our findings. Other reports in which TEWL was found to be higher in blacks may reflect the small sample sizes used by the investigators (7,15,16). Initial water content was found to be higher on the cheeks (p 0.05) and lower on the forearms and legs for blacks (Table I). Moisture accumulation (Table I) and the rate of moisture buildup (Figure 3) after a period of 60 seconds were found to be higher for blacks on the cheeks, but significantly lower on the forearms and legs. The rate of increase in continuous capacitance is inversely related to skin barrier competence (12).

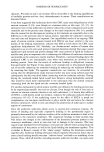
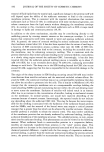
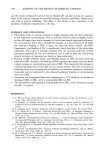
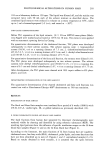
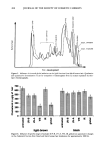
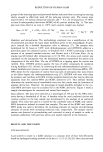
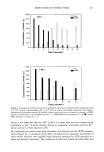
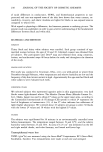
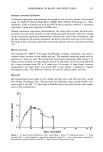
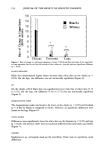
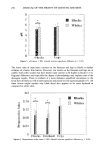
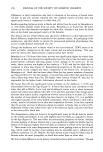
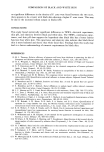
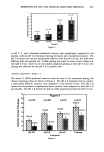
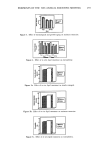
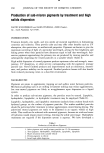
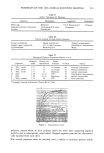
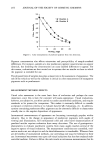
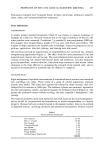
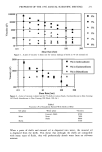
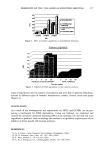
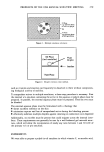
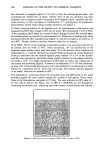
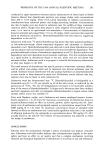
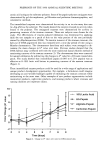
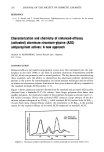
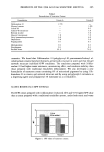
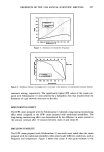
236 JOURNAL OF THE SOCIETY OF COSMETIC CHEMISTS 8 L F 1 F 0 ? i':. ?i"" :.: :.. ß ß ß . :.. ..... Cheeks Legs Blacks Whites Figure 5. pH (mean + SD). Asterisk indicates significant difference (p 0.05). The lower rates of capacitance increase on the forearms and legs in blacks is further evidence of a better skin barrier. However, our results on the forearms and legs are in conflict with other studies that have shown water content to be higher in blacks (7,15). Regional differences and especially the degree of photodamage may explain some of the divergent results. There is evidence of a more elaborate superficial vasculature in the facial skin of blacks as well as more apocrine and mixed eccrine-apocrine glands (17). All these factors might explain why black facial skin appears to be more hydrated as compared to white skin. 0.2 0.16 0.12 0.08 0.04 Cheeks Forehead Legs Blacks i Whites i ._a 4 4 Figure 6. Desquamation index (mean -+ SD). Asterisk indicates significant difference (p 0.05).
Purchased for the exclusive use of nofirst nolast (unknown)
From: SCC Media Library & Resource Center (library.scconline.org)