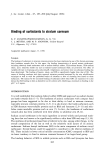
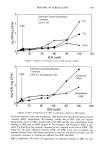
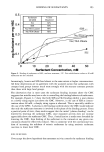
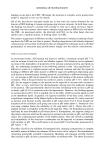
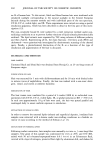
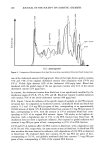
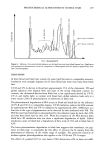
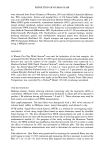
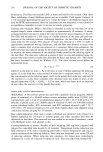
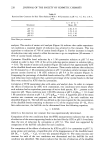
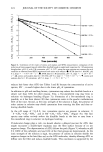
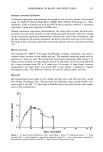
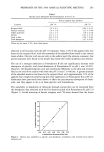
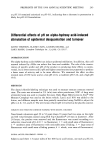
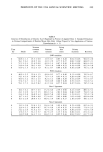
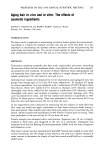
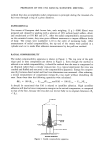
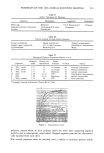
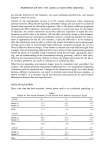
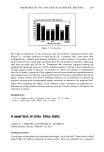
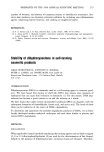
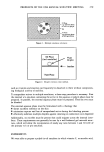
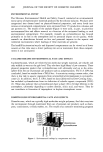
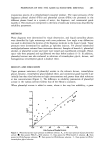
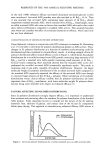
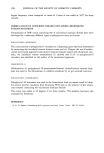
COMPARISON OF BLACK AND WHITE SKIN 231 Stratum corneum hydration Continuous capacitance measurements were made at each site for a period of 60 seconds using the NOVA © Dermal Phase Meter (DPM) 9003 (NOVA Technology Co., Mas- sachusetts, USA) in conjunction with the NOVA data acquisition software. Continuous capacitance values were expressed in DPM units. During continuous capacitance measurements, the probe head occludes the skin mea- surement site and values increase as water builds up under the probe. The first reading in the continuous capacitance measurement indicates the initial level of hydration, and the last reading (at 60 seconds) represents the level of moisture built up in 60 seconds. The slope of the continuous capacitance recordings indicates the rate of moisture buildup (12). Elastic recovery The Cutometer ©, SEM 474 (Courage and Khazaka, Cologne, Germany), was used to evaluate elastic recovery on the cheeks and legs. The standard measuring probe with an aperture of 2 mm was used. We utilized the stress/strain measuring mode (mode 2) in which suction pressure increases linearly from 0 to 200 mbar over 10 seconds followed by a linear decrease from 200 to 0 mbar over 10 seconds. A final elastic recovery measurement was made when the pressure fell to zero. Figure 1 illustrates a typical deformation curve. The difference between R0 and R4 reflects elastic recovery. Skin pH pH measurements were made on the cheeks and legs with a flat pH electrode, model 955 (Fisher, Pittsburgh, PA). The electrode was calibrated using standard buffer solu- tions at pH 4 and pH 7.0. One drop of distilled water was placed on the skin surface prior to the measurement. R0 o •'o •'o •o t • 20 30 Time (seconds) Figure 1. A typical elastic deformation curve using Mode 2 where: E = Amplitude (mm) t = Time (seconds) R0 = total deformation, expressed as amplitude (mm) R3 = elastic deformation, expressed in mm when the vacuum reaches 0 and R4 = elastic recovery when suction ceases.

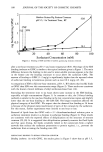
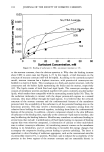
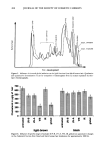
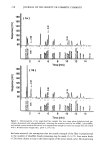
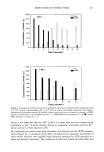
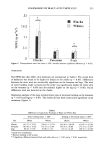
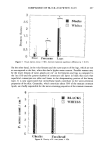
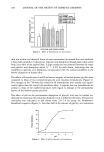
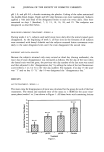
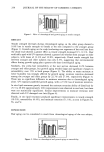
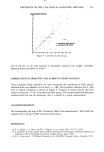
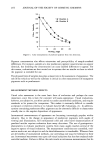
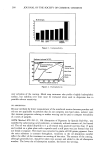
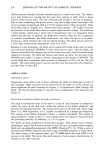
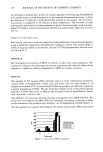
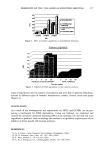
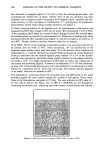
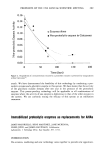
232 JOURNAL OF THE SOCIETY OF COSMETIC CHEMISTS Microbiology The modified Williamson and Kligman technique (the double-scrub method) (13) was used to identify and quantify organisms from the mid-forehead and cheeks. An area of 4 cm 2 was scrubbed twice using a sterile cotton swab moistened with 0.1% sterile Polysorbate 80 (Tween © 80, VWR Scientific, Philadelphia, PA) in 0.075 M phosphate buffer (pH 7.9) for a period of 20-30 seconds. The swab was immediately placed in a test tube containing 2 ml of the above detergent solution. Tenfold dilutions of the pooled scrub fluid were prepared using 0.05% Polysorbate 80 in 0.0375 M phosphate buffer as the diluent. Microorganisms were identified and counted by plating 50 Ixl of appropriately diluted pooled scrub fluid on Schaedler's agar medium. For aerobes, the media were incubated at 37øC for 48 hours. Incubation under anaerobic conditions was used to quantify Propionibacterium acnes. Assessment of dryness/scaling D-squames. D-squames (CuDerm Co., Dallas, TX) are adhesive-coated, clear discs de- signed to collect individual corneocytes or cell aggregates from the desquamating por- tion of the outer horny layer. These are now widely used in the quantitative assessment of dry, scaly, xerotic skin (14). Test sites on the forehead, cheeks, and legs were first delipidized by wiping with gauze soaked in ether-acetone (1:1). D-squames were then firmly applied for 5-10 seconds, followed by careful removal and placement on storage cards. D-squames were assessed by means of image analysis. The degree of scaling was quantified by integrating two parameters: a) the percentage area covered by scales and b) the distribution of scales according to five thickness levels to yield the desquamation index (14). Visual assessment. The lower legs, cheeks, and forehead were visually assessed for dryness/ scaling by using a 0-4 scale: 0: None 1: Mild = slight scaling 2: Moderate = small scales, minimal flaking 3: Moderately severe = larger scales and flakes 4: Severe = many large, loose scales with cracking and fissuring STATISTICAL ANALYSIS Data analysis was carried out using the two-tailed Student's t-test. A p-value 0.05 was considered significant. RESULTS TRANSEPIDERMAL WATER LOSS The TEWL data are presented in Figure 2. TEWL was lower in blacks, reaching statistical significance at p 0.05 on the legs and cheeks. TEWL in blacks was also lower on the forearm, but the difference was not statistically significant.
Purchased for the exclusive use of nofirst nolast (unknown)
From: SCC Media Library & Resource Center (library.scconline.org)