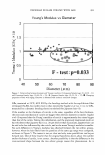
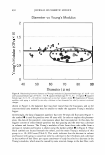
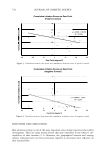
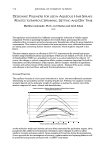
J. Cosmet. Sci. 1 58, 519-525 (September/October 2007) The differences in human cumulative irritation responses to positive and negative irritant controls from three geographical locations MING YI W. TRIMBLE, Hill Top Research, 3225 N. 7 5th Street, Scottsdale, AZ 85251 NALINI KAUL, Hill Top Research, 236 Osborne Street, Winnipeg1 Manitoba, Canada, R3L-2W2 and JOHN E. WILD and JAMES P. BOWMAN, Hill Top Research, 6088 Main and Mill Streets, Miamiville, OH 45147. Accepted for publication April 26, 2007. Synopsis A retrospective analysis was conducted to evaluate whether studies from three geographically diverse locations have similar response profiles to the positive and negative controls in a standard 14-day cumulative irritation study (1). The positive irritant control (0.1 % sodium lauryl sulfate, SLS) and the negative control (0.9% sodium chloride, saline) data from seventeen 14-day cumul�tive irritation studies were reviewed. The studies were compiled from three locations representing dry/hot, humid/hot, and dry/cold environments (Scottsdale, Arizona St. Petersburg, Florida and Winnipeg, Manitoba, respectively). Irritation scores were generated by trained skin graders from a total of 442 subjects studied between 1999 and 2005. Cumulative irritation scores were reviewed and compared between study locations. The irritation scores for the positive and negative controls were not significantly different between locations. Temperature and relative humidity (RH) variation did not correlate significantly with overall irritation. However, the dryer climate (i.e., negative or low dew point) had a tendency to induce a higher overall irritation level for both positive and negative controls. INTRODUCTION The cumulative irritation test is the industry standard used to determine and compare the irritation potential of topical agents (1). It has long been known that environmental and host factors may influence the state of skin conditions and therefore result in a change of cutaneous irritation (2,3). Historical positive and negative control data from seventeen 14-day cumulative irritation studies were reviewed from three climatically distinct study centers (Arizona, Florida, Manitoba). The objective of this analysis was to determine if the different study centers/climate conditions produced similar results for the positive and negative controls. 519

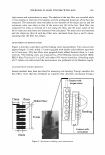
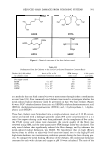
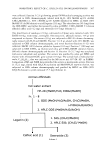
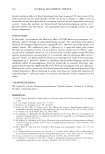
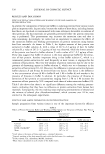
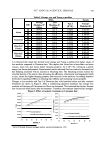
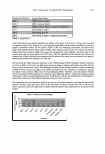
520 JOURNAL OF COSMETIC SCIENCE MATERIALS AND METHODS Seventeen 14-day cumulative irritation patch studies were selected from the Hill Top Research Data Base. All studies were conducted in accordance with Good Clinical Practices. Informed consent was obtained from all subjects prior to enrollment. Five studies from the Arizona study center, seven studies from the Florida study center, and five studies from the Manitoba study center were reviewed and included in this analysis. Table I exhibits the location, demographics, cumulative irritation scores, and climate conditions for each study. The seventeen studies selected were conducted at various times between 1999 and 2005 and followed the standard 14-day cumulative irritation test protocol. All volunteers were patched with 0.1 % w/v SLS (sodium laurel sulfate) and 0.9% w/v sodium chloride (saline) under full occlusion (nonwoven Webril® cotton pad covered by Blenderm™ on all four sides). Patches were applied on paraspinal skin sites for 14 consecutive days. Scoring for irritation and reapplication was done every 24 hours or until excessive irritation terminated further exposure. Trained skin graders scored the patch sites daily using the Berger and Bowman grading scale (Table II). Irritation was scored under a 100-watt incandescent blue bulb as the standard light source to illuminate the patch sites. Any test site reaching a numerical score of 3 or greater or any numerical score appended with a letter grade of F, G, or H was not repatched for the reminder of the study. Quality controlled local climatological data (average daily temperature and dew point or Table I Study Information No. of completed Cumulative RH Temperature Dew point No. of subjects irritation scores (%) ( ° C) (°C) Study subjects ID enrolled 0 j) 0.1% SLS Saline Mean ±SD Mean ±SD Mean ±SD AZ0l 32 11 20 31.l 1.0 52.6 ± 11.1 13.2 ±3.3 3.4 ±2.4 AZ02 21 6 9 26.9 0.3 24.0 ±4.5 35.4 ± 1.1 11.5 ±3.6 AZ03 65 23 37 28.1 2.5 14.3 ±3.9 33.8 ±2.3 2.5 ±4.5 AZ04 38 10 24 32.0 0.3 50.8 ± 12.5 14.6 ±2.4 4.2 ±2.2 AZ05 35 10 22 33.2 2.0 21.6 ±5.9 23.3 ±3.6 -0.2 ±3.3 FLOl 34 2 25 29.5 0.0 74.2 ±5.1 28.5 ±0.6 23.4 ± 1.1 FL02 35 6 21 30.1 0.0 66.8 ± 12.2 14.1 ±3.8 7.9 ±6.0 FL03 30 6 21 30.3 0.1 62.3 ±5.2 26.0 ± 1.1 18.2 ±2.1 FL04 30 9 16 31.0 0.2 74.9 ± 10.5 15.7 ±2.2 10.8 ±3.7 FL05 32 3 24 27.8 0.1 73.7 ±5.8 16.8 ±3.2 12.0 ±3.6 FL06 30 5 20 30.5 0.3 77.7 ±5.5 22.3 ±2.2 18.2 ±1.8 FL07 30 3 23 29.7 0.2 72.6 ±11.8 23.6 ±0.6 18.1 ±3.4 MB0l 21 8 9 26.3 0.2 73.0 ±8.1 18.9 ±4.0 13.8 ±3.5 MB02 20 9 7 32.1 2.4 80.8 ± 11.0 0.6 ±4.8 -2.4 ±4.4 MB03 20 5 11 30.7 3.0 74.6 ± 11.7 -23.4 ±6.2 -23.4 ± 7.1 MB04 20 8 11 32.0 0.3 77.9 ± 13.4 -23.6 ± 7.5 -23.6 ±9.3 MB05 22 11 7 28.4 0.3 53.7 ± 7.4 15.7 ±2.7 15.7 ±2.2 Total: 515 135 307
Purchased for the exclusive use of nofirst nolast (unknown)
From: SCC Media Library & Resource Center (library.scconline.org)