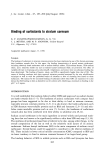
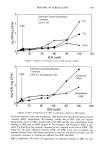
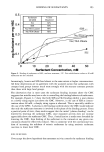
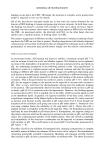
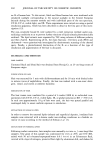
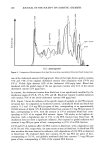
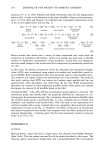
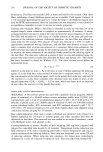
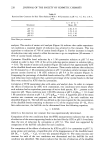
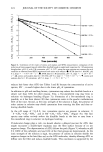
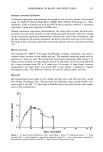
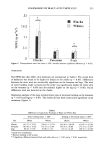
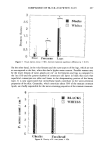
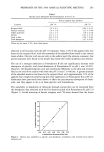
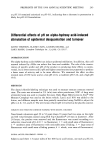
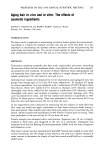
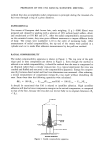
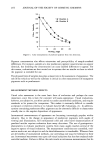
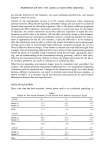
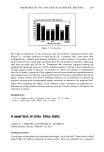
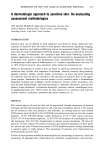
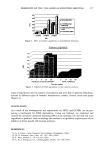
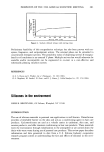
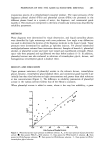
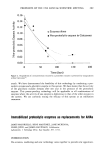
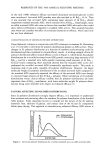
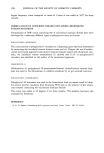
264 JOURNAL OF THE SOCIETY OF COSMETIC CHEMISTS 70 60 50 e 40 • 30 r• 20 10 --•,- Direction A []- Direction B 0 I I • I 0 10 20 30 40 Viewing Angle Figure 1. Color measurements of pearlized polymer from two directions. Pigment concentration also affects orientation and perceptibility of sample-standard differences. For instance, samples at a low pearlescent pigment concentration can appear identical, but doubling the concentration can cause marked differences to appear. For this reason, evaluations are best carried out in systems that are similar to those in which the pigment is intended for use. The physical form of samples also plays a major role in the assessment of appearance. The role of the vehicle as well as the substrate is critical in color measurements of transparent pigments such as pearlescence. MEASUREMENT METHOD EFFECTS Visual color assessment is the most basic form of evaluation and perhaps the most important, since this is how the customer will assess appearance. Visual evaluations, however, are subjective, are often carried out under uncontrolled conditions, and require standards to be present for comparison. This makes it extremely difficult to transfer acceptance or rejection criteria or to evaluate data for QC evaluations, etc. In addition, systems containingpearlescent effect pigments can be extremely difficult to characterize visually due to the angular dependence of appearance. Instrumental measurements of appearance are becoming increasingly popular within industry. Due to the change in appearance of pearlescent pigments with angles of viewing and illumination, full instrumental color and color travel characterization of pearlized articles requires evaluation from many directions. The use of goniospectro- photometers to evaluate pearlescent systems from many angles resolves several of the negative aspects of visual evaluation. The measurement conditions are controlled, eval- uation results are not subjective and the data/information is transferable. Whereas these are all benefits of instrumental methods, one overriding rule must be followed in their use: Instrumental measurements must agree with visual evaluations that have been conducted under controlled conditions. Failure to follow this rule results in extraneous measurements that do

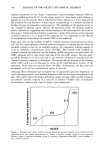
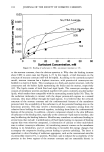
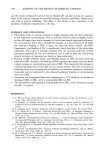
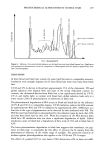
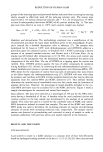
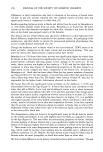
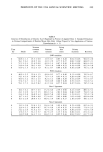
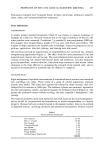
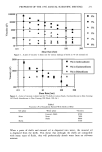
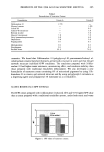
PREPRINTS OF THE 1996 ANNUAL SCIENTIFIC MEETING 265 not provide direction to the evaluator, can cause confusing specifications, and require frequent corrective action. Control of the measurement process is of the utmost importance when measuring pearlized articles. Many factors regarding instrument design and use must be considered beyond those required for absorption pigments. Due to the spatial reflection properties of pearlescent effect pigments, instrument geometry is crucial and must be controlled. In addition, the chosen instrument must have sufficient capability to make the mea- surement in which there is an interest. All too often evaluators choose a color measure- ment method based on instrument availability without considering whether the instru- ment is appropriate for the job. For instance, if specular reflection is to be evaluated, then the instrument must be able to achieve the proper illumination and viewing angle settings and be able to accommodate high reflectance intensities through the use of a filter or effective detector design. If one wishes to evaluate the total reflected light from a sample, then an integrating sphere must be used. Choice of the measurement geometry should be based on controlled visual evaluations using focused light, appropriate light- ing, and an understanding of the illumination/viewing geometry, which is then trans- ferred to the instrumental setup. Failure to choose the proper instrument for the job or an incorrect geometry can result in ambiguous or misleading data. Other factors regarding instrumental design must be considered and controlled. For instance, the optical geometry of goniospectrophotometers is not standardized regarding collimation and the measured area. Changes in the illumination angle, as is often found between different instruments, can result in reversed color trends between samples, as shown in Table I. It is therefore crucial that identical instrumentation be used between laboratories sharing data and specifications. DATA EVALUATION Once color data has been acquired, several points need to be considered regarding its Table I CIELab for Two Samples Measured 20 ø Off Specular With Different Illumination Angles 250/20 ø L* a* b* Sample A 35.1 42.1 - 8.7 Sample B 21.9 45.5 -- 4.1 Delta - 13.2 3.4 4.6 450/20 ø L* a* b* Sample A 38.7 42.2 - 2.9 Sample B 23.9 47.0 - 0.1 Delta - 14.8 4.8 2.9 650/20 ø L* a* b* Sample A 43.7 41.3 6.8 Sample B 26.5 48.0 4.6 Delta - 17.2 6.7 -- 2.2
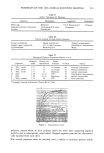
Purchased for the exclusive use of nofirst nolast (unknown)
From: SCC Media Library & Resource Center (library.scconline.org)