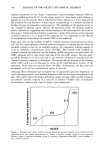
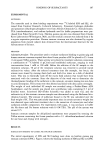
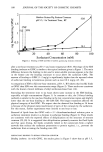
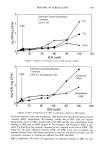
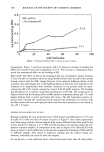
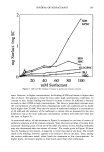
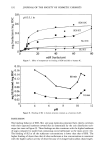
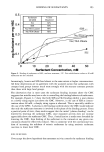
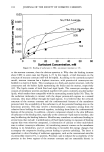
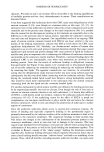
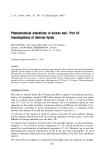
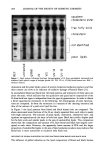
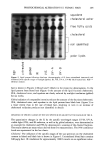
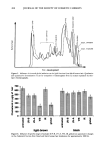
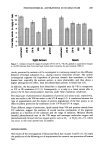
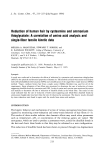
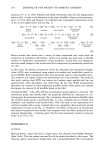
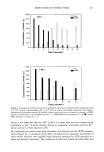
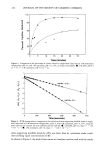
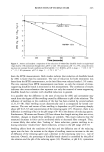
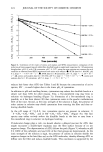
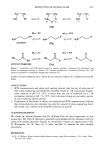
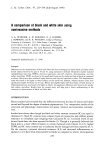
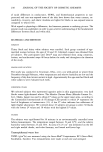
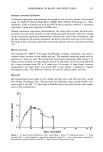
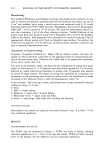
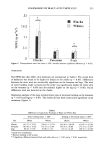
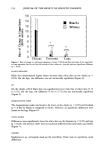
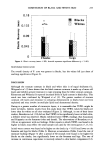
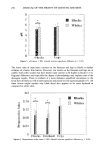
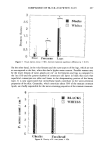
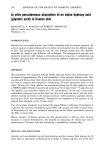
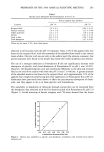
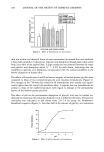
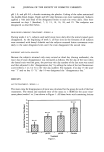
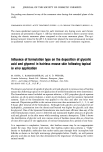
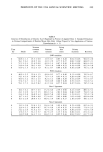
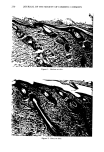
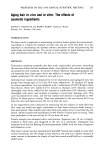
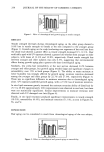
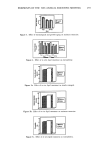
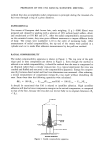
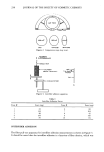
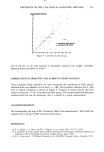
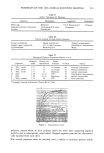
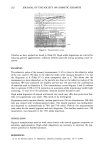
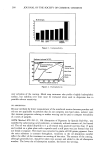
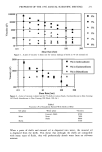
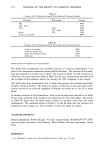
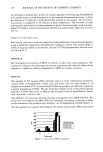
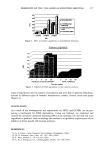
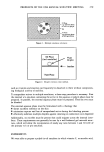
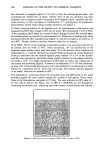
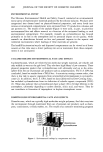
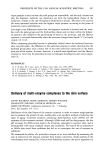
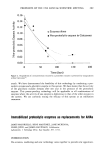
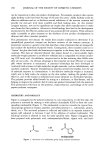
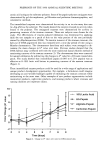
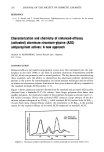
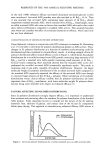
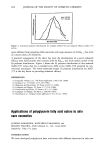
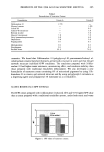
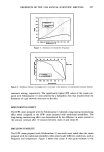
248 JOURNAL OF THE SOCIETY OF COSMETIC CHEMISTS No peeling was observed at any of the treatment sites during this extended phase of the study. COMPARISON OF EFFECT: ACUTE TREATMENT (WEEKS 1-3) VS CHRONIC TREATMENT (WEEKS 5-8) The mean epidermal turnover times for each treatment site during acute and chronic treatment are presented in Figure 3. All four treatments resulted in faster turnover times during the chronic treatment phase compared to the acute treatment phase. The epi- dermal turnover times for the pH 3. O-treated site showed the most pronounced increase in epidermal turnover rate between the acute- and chronic-use treatment regimens. Influence of formulation type on the deposition of glycolic acid and glycerol in hairless mouse skin following topical in vivo application M. OHTA, C. RAMACHANDRAN, and N. D. WEINER, Cosmetics Laboratory, Kanebo Ltd., Odawara, Kanagawa, Japan (M. O. ), and College of Pharmacy, University of Michigan, Ann Arbor, MI 48109-1065 (C.R., N.D.W.). The kinetics and extent of uptake ofglycolic acid and glycerol in various strata of hairless mouse skin following topical in vivo application of several formulations were determined. The formulations tested included an aqueous solution, a 30% propylene glycol aqueous solution, an oil-in-water emulsion, a water-in-oil emulsion, and two nonionic liposomal systems. Each of the formulations was applied to the skin and after one hour were removed. Deposition profiles in the various strata were then monitored at 0, 1, 2, 4, and 8 hours after removal of the formulation. Although both glycolic acid and glycerol are hydrophilic, penetration into the dermis and beyond was higher for glycolic acid than for glycerol. One of the liposomal formulations was much more efficient than any of the other formulations tested, since it delivered and maintained higher amounts of glycolic acid and glycerol in the skin strata while retarding systemic absorption. Table I shows the distribution of glycolic acid into various strata of hairless mouse skin as a function of time after topical in vivo application of various formulations for a period of one hour. It is important to emphasize, however, that hairless mouse may be an inappropriate model for man. Our recent work shows that hairless rodent skin presents a "leaky" barrier to hydrophilic molecules that rather easily pass through their incomplete hair follicles as shown in the light microscopy photographs below. Finally, we will present glycolic acid data on hairy rats that demonstrates the importance of choosing the correct animal model.

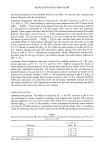
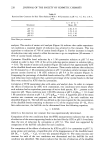
PREPRINTS OF THE 1996 ANNUAL SCIENTIFIC MEETING 249 Table I Kinetics of Distribution of Glycolic Acid (Expressed as Percent of Applied Dose +-- Standard Deviation) in Various Compartments of Hairless Mouse Skin After 1-Hour Topical In Vivo Application of Various Formulations (n = 3) Scrarum Living Time corneum Stratum skin Urinary (h) Swabs surface corneum strata excretion Recovery O/W emulsion 0 60.8 + 1.3 25.5 + 0.9 2.9 + 0.7 0.85 + 0.28 0.04 +- 0.03 90.0 +- 2.0 1 56.1 +- 6.1 24.9 + 2.6 4.9 + 2.9 0.77 +- 0.27 0.06 + 0.02 86.8 +- 2.1 2 57.2 + 2.3 21.6 +- 0.9 6.9 +- 1.4 0.87 + 0.30 0.10 +- 0.03 86.6 +- 0.3 4 54.0 +- 2.0 20.3 -+ 4.0 7.8 -+ 1.0 0.98 +- 0.23 0.14 -+ 0.05 83.2 +- 1.8 8 53.9 +- 1.5 16.2 +- 1.9 8.1 + 0.7 0.89 +- 0.26 0.36 +- 0.05 79.3 +- 1.8 W/O emulsion 0 46.9 + 5.2 22.4 +- 1.5 6.0 +- 0.2 0.77 + 0.40 0.11 + 0.02 76.2 +- 6.7 1 54.1 +- 3.4 18.8 +- 2.0 7.6 + 1.4 0.63 +- 0.31 0.20 +- 0.06 81.3 + 5.2 2 50.0 +- 3.2 18.1 +- 2.5 8.2 +- 1.2 0.88 + 0.29 0.32 +- 0.07 77.5 +- 0.7 4 57.4 + 4.7 12.1 + 2.6 5.0 +- 0.9 0.66 +- 0.28 0.35 + 0.15 75.6 +- 5.1 8 55.1 +- 7.2 16.2 +- 8.2 6.1 + 0.4 0.57 +- 0.04 0.47 +- 0.33 78.5 +- 1.6 Noa- 1 liposomes 18.4 -+ 4.2 49.7 -+ 4.5 17.2 +- 4.0 2.59 +- 0.90 0.22 -+ 0.07 88.1 +- 3.2 23.1 +- 4.9 32.1 +- 3.5 20.6 -+ 3.4 2.83 +- 0.84 0.40 +- 0.07 79.0 +- 3.6 23.4 +- 5.0 26.0 +- 4.2 19.8 +- 5.8 2.95 + 0.82 1.15 +- 0.11 72.5 +- 7.0 19.7 + 4.5 29.8 + 6.0 17.5 +- 8.1 2.02 + 0.80 1.81 + 0.49 69.0 +- 8.0 16.3 +- 2.0 28.0 +- 5.3 10.9 + 3.9 0.81 +- 0.27 2.10 +- 0.59 58.1 +- 5.5 Noa-2 liposomes 0 13.2 + 2.0 52.6 + 5.1 13.6 +-- 3.8 1.92 +- 0.93 0.15 +_ 0.03 81.5 +- 2.3 1 12.6 +- 3.3 48.8 +- 8.7 14.7 ___ 4.0 1.45 +-- 0.15 0.13 +- 0.02 77.6 --- 2.3 2 21.2 +_ 2.6 41.6 +-- 3.5 9.9 +- 2.6 1.02 ___ 0.39 0.20 +_ 0.10 73.9 +- 3.0 4 17.6 +- 3.7 33.1 --- 5.7 14.7 +_ 2.5 1.15 + 0.34 0.49 +-- 0.11 67.1 --+ 4.1 8 11.0 +- 0.8 34.3 + 1.3 14.6 +_ 1.2 0.95 +- 0.36 0.83 +- 0.12 61.7 +- 2.6
Purchased for the exclusive use of nofirst nolast (unknown)
From: SCC Media Library & Resource Center (library.scconline.org)