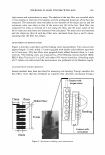
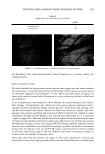
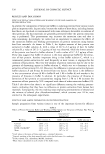
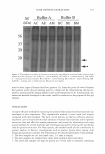
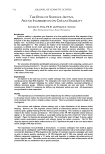
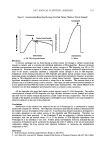
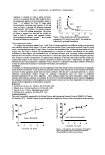
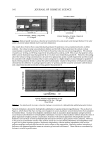
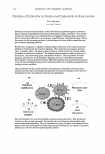
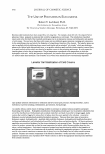
594 JOURNAL OF COSMETIC SCIENCE STRATEGIES FOR CONTROLLING MOISTURE FLUX IN SKIN CELLS James V. Gruber, Ph.D., Lisa Bouldin, Suzanne Wilford and Robert Holtz Arch Personal Care Introduction It is well established that human skin, which comprises about 70 microns of the outer protective cover for humans, is the principal barrier against the body's dehydration. Within the confines of the stratum comeum, epidermis and dermis lies a water gradient that is low at the surface of the skin and increases quickly as one probes deeper into the skin [ 1]. This water gradient can be modified by topical applications of various moisturizers and occlusive barrier enhancers, glycerin and water being the most fundamentally basic [2]. However, to actually control water flux, i.e., the movement of water across cellular membranes, a more detailed strategy of water control is required. For instance, keratinocyte cellular membranes contain proteins called aquaporins which control the movement of the highly polar water and glycerol molecules through the non-polar lipid membrane. Inside the cell, osmolytes are created that bind water and hold it inside the cell, particularly during highly dehydrative events [3-5]. A strategy for controlling water flux must address elements of all of these events. Methods Human Keratinocvte Cell Culture Human epidermal keratinocytes were seeded into culture flasks and grown at 37±2 ° C and 5±1% CO2 using Epilife media supplemented as recommended by the manufacturer. When a sufficient number of cells had been grown they were seeded into 12-well plates at a low cell density and cultured for a minimum of 24 hours to allow the cells to adhere to the well plates. Treatment ofKeratinocvtes The test materials were prepared in Epilife media and filter sterilized. The media was then removed from the culture plates and replaced with one ml of media supplemented with test material. Epilife media alone served as the untreated control. After the application of the cell culture media, the plates were incubated for 24 hours at 37±2 ° C and 5±1%CO2. At the end of the incubation period the culture media was replaced with one ml of fresh media without test materials. Keratinocvte Dehydration For the dehydration process, the 12-well plate was secured to a microscope stage and positioned such that a field of clearly defined cells was visible through the microscope (250x magnification). Compressed room air was then channeled through a tube such that the air flow was directed at the surface of the culture media. The air flow through the tube was set to a flow rate of 10 liters per minute. At this flow rate the air current was sufficient to evaporate the water in the media without visibly disturbing the surface of the culture media. Digital images of the cells and samples of culture media (10 µ1) were obtained immediately prior to starting the airflow (time = 0) and after 5, 10, 15 and 20 minutes of airflow.

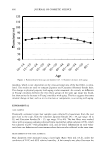
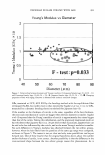
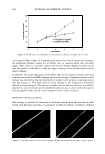
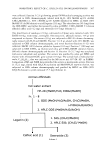
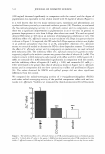
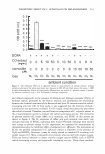
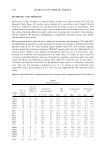
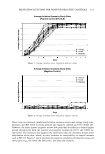
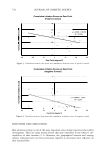
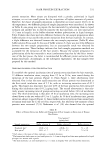
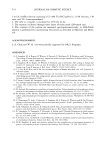
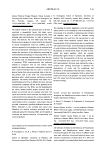
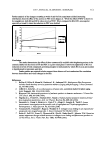
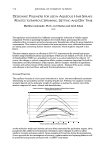
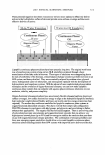
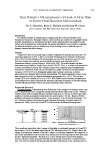
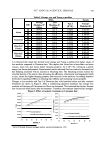
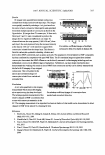
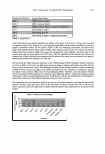
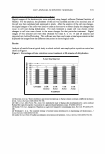
2007 ANNUAL SCIENTIFIC SEMINAR 595 Measurement of Changes in Keratinocyte Cell Size Digital images of the keratinocytes were analyzed using ImageJ software (National Institute of Health). For the analysis, the perimeter of the cell was outlined and the cross sectional area of the cell was then calculated and expressed in pixels. After the analysis of the cell size changes, the digital images of the cells were used to create a short movie to better display the changes that occur in cell size during dehydration. For each treatment a single cell was chosen whose changes in cell size were closest to the mean changes for that particular treatment. Digital images of this selected cell were then obtained for times 0, 5� 10, 15 and 20 minutes and imported into Adobe Photoshop. This software was then used create a time lapse animation that displayed the images from the different time points in chronological order. Results Analysis of results from a typical study in which sorbitol was employed as a positive control are shown in Figure 1. Figure I. Percentage cell size retention verses treatment at 20 minutes of dehydration % Cell Size Retention C :8 100 C 90 +-----------t---------=�----+------i JI 80 --+-----+----1---- 1 70 • 60 ii 50 ii 40 U 30 1: 20 � 10 l. a Untreated 0.5% Sorbitol 0.5% Active Treatment 1.0% Active 2.0% Active [1] Bouwstra JA et al., Water distribution and related morphology in 1mrnan stratum comeum at different hydration levels. J Invest Dermatol. 120 (2003) 750-758. [2] Chrit L et al., Skin Pharm Phy. An in vivo randomized study of human skin moisturization by a new confocal Raman fiber-optic microprobe: Assessment of a glycerol-based hydration cream. 19 (2006) 207-215 [3] Mariko H.C et al., Aquaporin-3 functions as a glycerol transporter in mammalian skin Biol Cell. 91 (2005) 479- 486. [4] Warskulat U. et al., The osmolyte strategy of normal human keratinocytes in maintaining cell homeostasis. J Invest Dermatol. 123 (2004) 516-521. [5] Janeke Get al., Role of Taurine accumulation in keratinocyyte hydration J Invest dermtol. 121 (2003) 354-361.
Purchased for the exclusive use of nofirst nolast (unknown)
From: SCC Media Library & Resource Center (library.scconline.org)