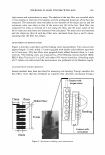
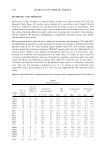
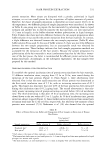
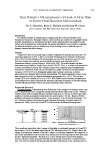
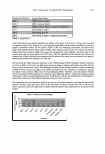
520 JOURNAL OF COSMETIC SCIENCE MATERIALS AND METHODS Seventeen 14-day cumulative irritation patch studies were selected from the Hill Top Research Data Base. All studies were conducted in accordance with Good Clinical Practices. Informed consent was obtained from all subjects prior to enrollment. Five studies from the Arizona study center, seven studies from the Florida study center, and five studies from the Manitoba study center were reviewed and included in this analysis. Table I exhibits the location, demographics, cumulative irritation scores, and climate conditions for each study. The seventeen studies selected were conducted at various times between 1999 and 2005 and followed the standard 14-day cumulative irritation test protocol. All volunteers were patched with 0.1 % w/v SLS (sodium laurel sulfate) and 0.9% w/v sodium chloride (saline) under full occlusion (nonwoven Webril® cotton pad covered by Blenderm™ on all four sides). Patches were applied on paraspinal skin sites for 14 consecutive days. Scoring for irritation and reapplication was done every 24 hours or until excessive irritation terminated further exposure. Trained skin graders scored the patch sites daily using the Berger and Bowman grading scale (Table II). Irritation was scored under a 100-watt incandescent blue bulb as the standard light source to illuminate the patch sites. Any test site reaching a numerical score of 3 or greater or any numerical score appended with a letter grade of F, G, or H was not repatched for the reminder of the study. Quality controlled local climatological data (average daily temperature and dew point or Table I Study Information No. of completed Cumulative RH Temperature Dew point No. of subjects irritation scores (%) ( ° C) (°C) Study subjects ID enrolled 0 j) 0.1% SLS Saline Mean ±SD Mean ±SD Mean ±SD AZ0l 32 11 20 31.l 1.0 52.6 ± 11.1 13.2 ±3.3 3.4 ±2.4 AZ02 21 6 9 26.9 0.3 24.0 ±4.5 35.4 ± 1.1 11.5 ±3.6 AZ03 65 23 37 28.1 2.5 14.3 ±3.9 33.8 ±2.3 2.5 ±4.5 AZ04 38 10 24 32.0 0.3 50.8 ± 12.5 14.6 ±2.4 4.2 ±2.2 AZ05 35 10 22 33.2 2.0 21.6 ±5.9 23.3 ±3.6 -0.2 ±3.3 FLOl 34 2 25 29.5 0.0 74.2 ±5.1 28.5 ±0.6 23.4 ± 1.1 FL02 35 6 21 30.1 0.0 66.8 ± 12.2 14.1 ±3.8 7.9 ±6.0 FL03 30 6 21 30.3 0.1 62.3 ±5.2 26.0 ± 1.1 18.2 ±2.1 FL04 30 9 16 31.0 0.2 74.9 ± 10.5 15.7 ±2.2 10.8 ±3.7 FL05 32 3 24 27.8 0.1 73.7 ±5.8 16.8 ±3.2 12.0 ±3.6 FL06 30 5 20 30.5 0.3 77.7 ±5.5 22.3 ±2.2 18.2 ±1.8 FL07 30 3 23 29.7 0.2 72.6 ±11.8 23.6 ±0.6 18.1 ±3.4 MB0l 21 8 9 26.3 0.2 73.0 ±8.1 18.9 ±4.0 13.8 ±3.5 MB02 20 9 7 32.1 2.4 80.8 ± 11.0 0.6 ±4.8 -2.4 ±4.4 MB03 20 5 11 30.7 3.0 74.6 ± 11.7 -23.4 ±6.2 -23.4 ± 7.1 MB04 20 8 11 32.0 0.3 77.9 ± 13.4 -23.6 ± 7.5 -23.6 ±9.3 MB05 22 11 7 28.4 0.3 53.7 ± 7.4 15.7 ±2.7 15.7 ±2.2 Total: 515 135 307

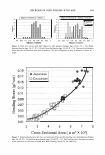
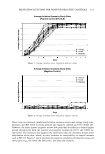
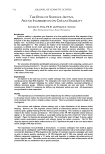
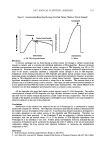
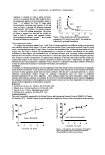
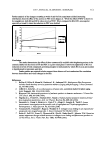
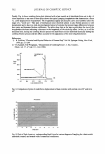
IRRITATION OUTCOME FOR POSITIVE/NEGATIVE CONTROLS 521 Numerical score 0 = No evidence of irritation 1 = Minimal erythema, barely perceptible Table II Scoring Scale 2 = Moderate erythema, readily visible or minimal edema or minimal papular response 3 = Strong erythema or erythema and papules 4 = Definite edema 5 = Erythema, edema, and papules 6 = Vesicular eruption 7 = Strong reaction spreading beyond test site Letter grade A = Slightly glazed appearance B = Marked glazing C = Glazing with peeling and cracking F = Glazing with fissures G = Film of dried serous exudate covering all or portion of the patch site H = Small petechial erosions and/or scabs relative humidity, RH) were obtained from the National Climatic Data Center for the US locations and the Environment Canada Meteorological Services for the Canadian location. Average RH representing each study day was calculated using the average dew point and average temperature, with appropriate equations when information was not directly available. Since humans tend to relate discomfort to the combination of hu midity and temperature, RH and dew point were utilized representing the humidity levels. Table I summarizes the average temperature (°C), RH(%) and dew point (°C) for each study. STATISTICAL ANALYSIS The actual patch test scores are a combination of a numerical and letter score consistent with the definitions given in the scoring scale (Table II). In order to perform statistical analyses, scores containing letter grades were converted to numerical equivalents. These were converted as follows: A=0 B= 1 C=2 and F, G, and H=3. These equivalents are considered additive to any numerical score (e.g., 2C=2+2=4). However, an upper limit of 3 is selected since the intent of a 14-day cumulative irritation test was to compare treatments that are relatively mild. Thus, for any value greater than 3, a value of 3 is used in the statistical analysis. Furthermore, following the development of a strong reaction, no further exposure was made and a score of 3 was carried forward for all scoring days for the remainder of the test. The daily irritation scores from completed study subjects were averaged. The overall cumulative irritation scores were the summation of the 14-day daily average. The overall cumulative irritation scores for each study are shown in Table I. Analysis of variance (ANOV A) was utilized to compare the differences in overall irri tation, temperature, RH, and dew points among the three geographical sites and to compare the overall irritation level between the positive and negative control test materials (Table III). Regression analysis was performed to see if the overall irritation score correlated with the climatic factors (i.e., temperature, RH, and dew point) (Ta ble IV). RESULTS Approximately 85% (71-97%) of the enrolled subjects completed the study. The pri mary reason for early subject withdrawal was scheduling conflict that is unrelated to the
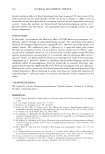
Purchased for the exclusive use of nofirst nolast (unknown)
From: SCC Media Library & Resource Center (library.scconline.org)