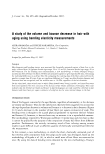
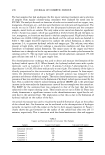
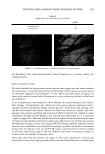
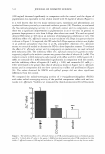
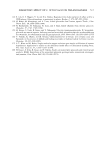
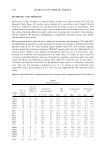
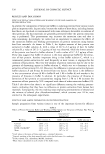
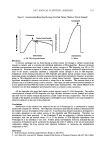
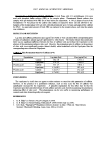
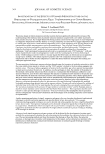
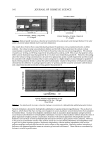
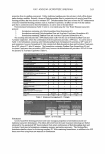
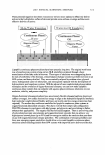
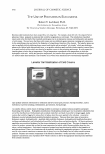
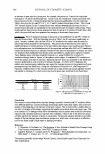
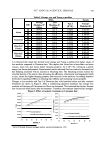
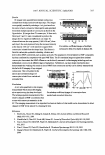
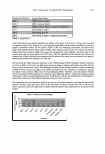
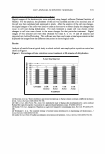
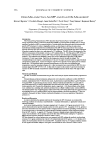
522 JOURNAL OF COSMETIC SCIENCE Table III ANOV A Test Results among Study Centers Mean ± SD Arizona Florida Manitoba p-value Cumulative irritation (0.1 % SLS) 30.3 ± 2.7 29.9 ± 1.0 29.9 ± 2.5 0.941 Cumulative irritation (saline) 1.2 ± 1.0 0.1 ± 0.1 1.2 ± 1.3 0.084 p-value 0.05 0.05 0.05 Temperature (QC) 24.1 ± 10.4 21.0 ± 5.52 -2.4 ± 20.5 0.009 Relative humidity(%) 32.7 ± 17.8 71.7 ± 5.3 72 ± 10.7 0.000 Dew point (QC) 4.3 ± 4.4 15.5 ± 5.4 -3.98 ± 19.2 0.028 Table IV Regression Analysis Test Results between Irritation Scores and Climatic Factors Irritation scores (y) vs climatic factors (x) Regression equation r2 F value p-value 0.1 % SLS vs average temperature (QC) y = -0.05x + 30.75 0.19 3.76 0.077 0.1 % SLS vs RH(%) y = 0.0lx + 29.27 0.02 0.25 0.621 0.1 % SLS vs dew point (QC) y = 0.07x + 30.41 0.20 3.76 0.071 Saline vs average temperature (QC) y = -0.02x + 1.07 0.10 1.76 0.205 Saline vs RH(%) y = -0.0lx + 1.62 0.09 1.46 0.244 Saline vs dew point (QC) y = -0.04x + 1.07 0.38 9.11 0.009 test products. The completion rates were not significantly different between locations. The repetitive exposure to 0.1 % SLS under occlusion began showing skin irritation responses on Days 3 and 4 (when average panel scores were 0.5), and the irritation scores tended to plateau after Day 8 (when average panel scores were 2.5) for each study and study center (Figure 1). Repeated exposure to saline under occlusion illustrated minimal signs of irritation (when average panel scores were approximately 0.5 or less) for the entire study duration for each study and study center (Figure 2). As occlusion by itself may induce cutaneous irritation (4), daily average irritation scores of approximately 0.5 on average is reasonably expected, as that represents less than one half of the subjects eliciting a barely perceptible minimum sign of erythema. All studies, regardless of climate conditions, concluded that 0.1 % SLS induced statis tically significantly higher irritation levels than saline (p 0.05). The overall cumulative irritation scores for the positive and the negative control test materials were not sig nificantly different between study centers (p=0.941 and P=0.084), respectively (Ta ble III). The average temperature, RH, and dew point at each study center were significantly different between selected study centers (Table III). Manitoba studies were conducted under an average temperature of -2.4 ° C that was significantly lower than that of Arizona and Florida (between 21 °-24°C for these centers). Florida studies were con ducted under an average dew point of 15.5°C that was significantly higher than that of Arizona and Manitoba (between 4.0 and -4.0°C for these centers, respectively). Arizona studies were conducted under an average RH of 33% that was significantly lower than that of Florida and Manitoba (approximately 72% for both centers.).

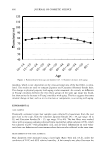
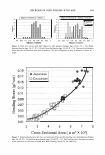
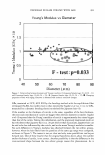
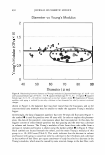
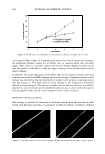
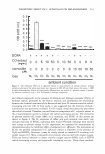
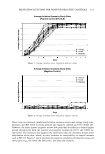
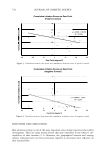
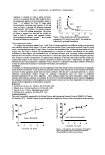
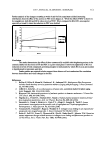
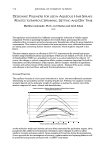
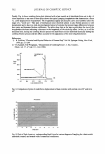
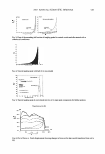
IRRITATION OUTCOME FOR POSITIVE/NEGATIVE CONTROLS 523 ! 8 C i0 1,5 ·1--- --···· - ·c:: GI Average Irritation Scores by Study Sites (Positive Control 01 % SLS) � 1+-- - - �-#'"F--,,.,-- - - - - - - - ---- - - - - 7 0 CJ (/) C 0 A: Arizona 0.5 1----.&::: ...... r-��- - - - - - - - --- - - -------------1 ■: Florida •: Manitoba 10 11 12 13 Days Figure 1. Average irritation scores induced by positive control. Average Irritation Scores by Study Sites (Negative Control) •: Arizona ■: Florida 14 2.5 +---------- - - - - ------------------1 •: Manitoba � 1.5 GI i 1+------------- --- - - -----------7 10 11 12 13 14 Days Figure 2. Average irritation scores induced by negative control. There were no statistical correlations between irritation scores and average study tem peratures and RH levels for both positive and negative controls (p0.05) (Table IV). However, the dryer climate (negative or low dew point) had a tendency to induce higher overall irritation for both the positive and negative controls (p=0.071 and 0.009, re spectively). The literature also supports the observation that dry climates promote more dehydration of the skin, which, in turn, increases its susceptibility to topical irritants such as SLS (3). Figures 3 and 4 illustrate the negative correlation of irritation scores and dew points (e.g., the lower the dew point, the dryer the climate).
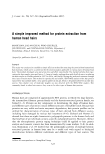
Purchased for the exclusive use of nofirst nolast (unknown)
From: SCC Media Library & Resource Center (library.scconline.org)