605 SKIN MICROBIOME INNOVATIONS
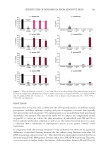
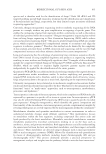
count technique. The activity of the test material inoculated is evaluated at 30 seconds, 1,
5, 10, and 30 minutes after initial inoculation to quantitatively determine the concentration
of viable microorganisms remaining after incubation time. Cell viability is evaluated by
calculating the log reduction between the measured initial microbial population and the
surviving microbial population after each time interval. Results from the time kill test are
evaluated two days later.
RESULTS
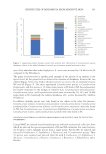
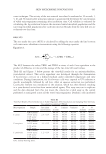
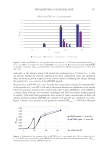
The area under the curve (AUC) is calculated by adding the areas under the line between
each consecutive absorbance measurement using the following equation:
Equation 1.
AUC t TKR
i i i i+1
i=0
n-1
=-+
+
∑(t 1
2 1 )(TKR )
The AUC between the values TKR1 and TKR2 at times t1 and t2 are equivalent to the
product of difference in time and the average of the two time kill result values.
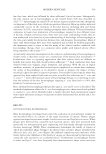
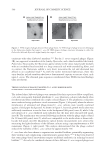
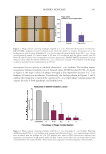
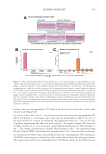
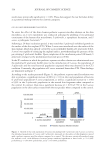
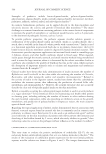
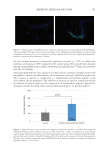
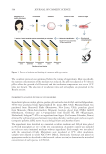
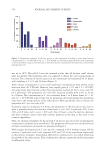
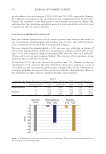
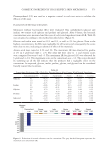
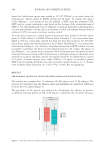
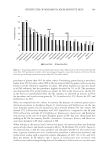
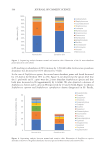
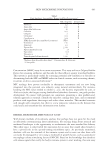
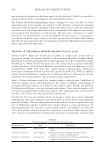
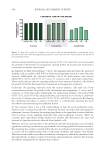
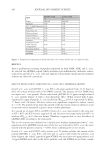
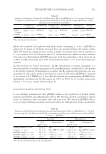
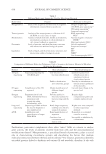
Table III and Figure 3 below present the time-kill results for an antimicrobial-free,
yeast-derived extract. This active ingredient was developed through the fermentation
of Saccharomyces cerevisiae in a defined medium under controlled temperature and time
conditions. During fermentation, the Saccharomyces cells were exposed to UV radiation at
specific wavelengths, followed by cell lysis. After an aqueous extraction was performed,
Lactobacillus ferment was introduced to the solution, which was then filtered, resulting
in a yeast-derived active free from antimicrobial agents. This assay was run in triplicate
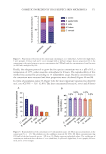
and the data obtained from this run meets the criteria for a valid assay as the control
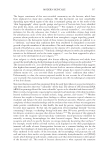
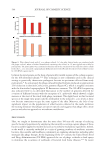
performed as anticipated across all the tested microorganisms. Dendritic cells incubated
Table III
Time Kill Results: Percent Reduction in Viable Organisms After Inoculation and Sampling Time Intervals,
Inoculum Concentration CFU/mL
Microorganism Sample Inoculum
concentration
30
seconds
1 minute 5 minutes 10
minutes
30
minutes
CM (Control) 80.5% 81.2% 81.0% 83.3% 85.1%
S. aureus 0.01% active
0.1% active
2.5 × 10⁶ 99.9%
99.9%
99.9%
99.9%
99.9%
99.9%
99.9%
99.9%
99.9%
99.9%
1.0% active 99.9% 99.9% 99.9% 99.9% 99.9%
CM (Control) 73.5% 78.1% 81.2% 83.3% 84.3%
P. aeruginosa 0.01% active 4.1 × 10⁶ 99.9% 99.9% 99.9% 99.9% 99.9%
0.1% active 99.9% 99.9% 99.9% 99.9% 99.9%
1.0% active 99.9% 99.9% 99.9% 99.9% 99.9%
CM (Control) 38.3% 56.1% 60.2% 75.2% 62.3%
S. epidermidis 0.01% active
0.1% active
1.2 × 10⁶ 23.2%
25.3%
38.1%
36.1%
42.1%
35.1%
43.3%
42.4%
43.9%
44.5%
1.0% active 22.3% 43.1% 45.3% 46.2% 43.5%
CFU: Colony Forming Units.
count technique. The activity of the test material inoculated is evaluated at 30 seconds, 1,
5, 10, and 30 minutes after initial inoculation to quantitatively determine the concentration
of viable microorganisms remaining after incubation time. Cell viability is evaluated by
calculating the log reduction between the measured initial microbial population and the
surviving microbial population after each time interval. Results from the time kill test are
evaluated two days later.
RESULTS
The area under the curve (AUC) is calculated by adding the areas under the line between
each consecutive absorbance measurement using the following equation:
Equation 1.
AUC t TKR
i i i i+1
i=0
n-1
=-+
+
∑(t 1
2 1 )(TKR )
The AUC between the values TKR1 and TKR2 at times t1 and t2 are equivalent to the
product of difference in time and the average of the two time kill result values.
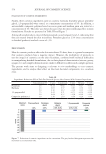
Table III and Figure 3 below present the time-kill results for an antimicrobial-free,
yeast-derived extract. This active ingredient was developed through the fermentation
of Saccharomyces cerevisiae in a defined medium under controlled temperature and time
conditions. During fermentation, the Saccharomyces cells were exposed to UV radiation at
specific wavelengths, followed by cell lysis. After an aqueous extraction was performed,
Lactobacillus ferment was introduced to the solution, which was then filtered, resulting
in a yeast-derived active free from antimicrobial agents. This assay was run in triplicate
and the data obtained from this run meets the criteria for a valid assay as the control
performed as anticipated across all the tested microorganisms. Dendritic cells incubated
Table III
Time Kill Results: Percent Reduction in Viable Organisms After Inoculation and Sampling Time Intervals,
Inoculum Concentration CFU/mL
Microorganism Sample Inoculum
concentration
30
seconds
1 minute 5 minutes 10
minutes
30
minutes
CM (Control) 80.5% 81.2% 81.0% 83.3% 85.1%
S. aureus 0.01% active
0.1% active
2.5 × 10⁶ 99.9%
99.9%
99.9%
99.9%
99.9%
99.9%
99.9%
99.9%
99.9%
99.9%
1.0% active 99.9% 99.9% 99.9% 99.9% 99.9%
CM (Control) 73.5% 78.1% 81.2% 83.3% 84.3%
P. aeruginosa 0.01% active 4.1 × 10⁶ 99.9% 99.9% 99.9% 99.9% 99.9%
0.1% active 99.9% 99.9% 99.9% 99.9% 99.9%
1.0% active 99.9% 99.9% 99.9% 99.9% 99.9%
CM (Control) 38.3% 56.1% 60.2% 75.2% 62.3%
S. epidermidis 0.01% active
0.1% active
1.2 × 10⁶ 23.2%
25.3%
38.1%
36.1%
42.1%
35.1%
43.3%
42.4%
43.9%
44.5%
1.0% active 22.3% 43.1% 45.3% 46.2% 43.5%
CFU: Colony Forming Units.