543 Modern Skincare
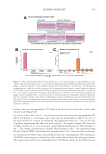
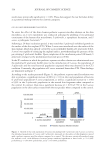
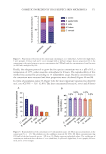
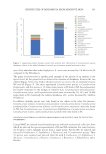
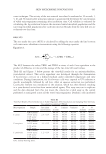
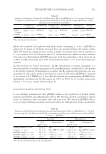
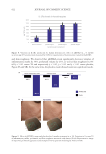
baseline, there was an approximate 25% drop in sebum levels as early as day 3 in.the pilot
clinical study (Figure 6A).
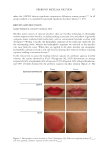
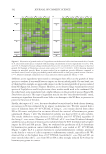
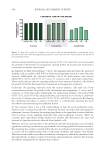
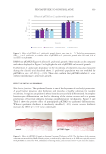
As a part of their life cycle, C. acnes bacteria produce the molecule coproporphyrin III,
which will fluoresce a red-orange color under specific wavelengths of light.58 As such, it
has been utilized as a means of evaluating the population levels of C. acnes on the skin
of patients experiencing the effects of acne vulgaris.59 As shown in Figure 6B, there was
a visible decrease in C. acnes associated coproporphyrin III fluorescence from baseline to
day 7. The change in fluorescence intensity from baseline to day 7 was quantified using
ImageJ software (NIH), which indicated an approximate 20% reduction (data not shown).
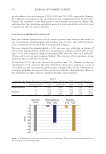
To corroborate the fluorescence measurements from the coproporphyrin III examination,
16S rRNA sequencing was conducted on skin swabs collected from the study participants.
This sequencing method, first established by Dr. Carl Woese, allows for the differentiation
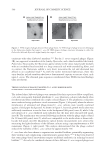
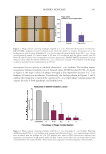
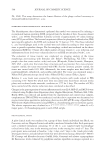
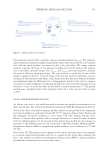
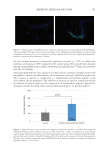
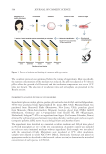
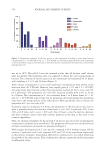
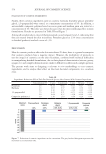
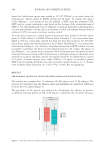
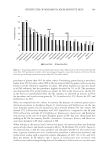
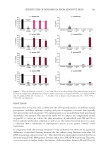
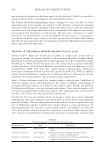
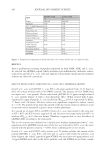
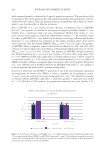
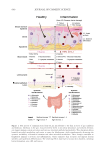
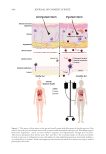
Figure 5. Three-dimensional blemished skin model. A) C. acnes targeted phage cocktail exhibits no tissue
toxicity when topically applied on a C. acnes-infused blemish-prone three-dimensional skin tissue model. The
phage cocktail was applied at three different dilution levels and allowed to incubate for 24 h. Histological
examination was conducted on those tissues as well as untreated tissue (negative control) and tissue exposed
to 0.1% SDS (cytotoxic positive control). B) The tissue described in (A) was further examined for a reduction
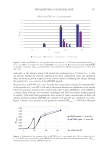
in C. acnes levels in response to the phage cocktail application. As shown, at all of the dilutions applied, the
phage cocktail diminished the C. acnes levels relative to tissue not exposed to the phage cocktail. C) The tissue
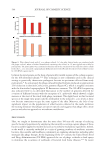
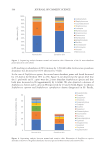
was also tested for changes in the levels of inflammatory factors normally associated with blemished skin.
The levels of IL-8 were significantly reduced in the blemished skin tissue model relative to untreated controls
(right side of graph, orange bars), and achieved levels as low as those observed in healthy skin tissue (left side
of graph, peach bars).
baseline, there was an approximate 25% drop in sebum levels as early as day 3 in.the pilot
clinical study (Figure 6A).
As a part of their life cycle, C. acnes bacteria produce the molecule coproporphyrin III,
which will fluoresce a red-orange color under specific wavelengths of light.58 As such, it
has been utilized as a means of evaluating the population levels of C. acnes on the skin
of patients experiencing the effects of acne vulgaris.59 As shown in Figure 6B, there was
a visible decrease in C. acnes associated coproporphyrin III fluorescence from baseline to
day 7. The change in fluorescence intensity from baseline to day 7 was quantified using
ImageJ software (NIH), which indicated an approximate 20% reduction (data not shown).
To corroborate the fluorescence measurements from the coproporphyrin III examination,
16S rRNA sequencing was conducted on skin swabs collected from the study participants.
This sequencing method, first established by Dr. Carl Woese, allows for the differentiation
Figure 5. Three-dimensional blemished skin model. A) C. acnes targeted phage cocktail exhibits no tissue
toxicity when topically applied on a C. acnes-infused blemish-prone three-dimensional skin tissue model. The
phage cocktail was applied at three different dilution levels and allowed to incubate for 24 h. Histological
examination was conducted on those tissues as well as untreated tissue (negative control) and tissue exposed
to 0.1% SDS (cytotoxic positive control). B) The tissue described in (A) was further examined for a reduction
in C. acnes levels in response to the phage cocktail application. As shown, at all of the dilutions applied, the
phage cocktail diminished the C. acnes levels relative to tissue not exposed to the phage cocktail. C) The tissue
was also tested for changes in the levels of inflammatory factors normally associated with blemished skin.
The levels of IL-8 were significantly reduced in the blemished skin tissue model relative to untreated controls
(right side of graph, orange bars), and achieved levels as low as those observed in healthy skin tissue (left side
of graph, peach bars).