572 JOURNAL OF COSMETIC SCIENCE
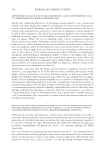
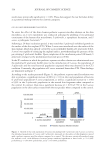
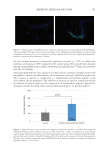
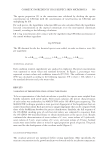
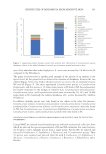
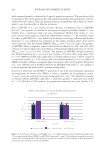
are also subjected to ratio variations: CI 6.9–10.4% and 7.6–12.6%, respectively. However,
the coefficients of variation on the concentrations were comprised between 2.9 and 4.2%.
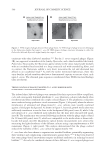
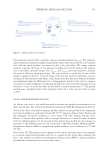
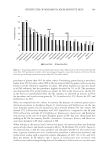
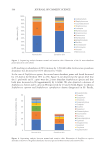
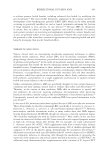
Overall, the variability is low with regard to the bacterial concentrations (Figure 4B),
indicating that the consortium preparation protocol is very reproducible and can be used
to analyze the effect of cosmetic products.
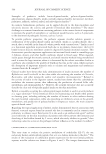
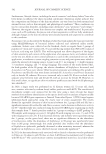
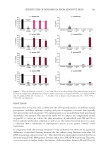
EVALUATION OF PRESERVATIVE SUBSTANCES
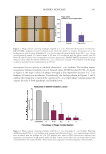
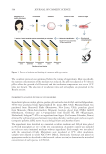
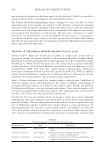
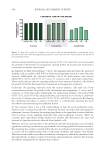
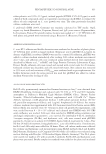
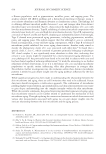
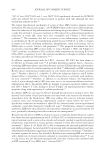
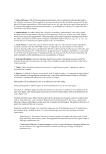
First, two common preservatives used in cosmetic products were tested on the model, at
two concentrations: phenoxyethanol and parabens (mix of ethyl- and methyl parabens).
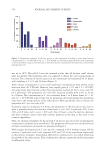
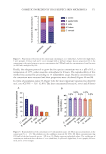
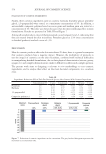
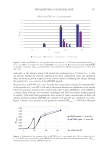
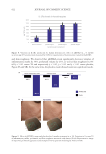
Scores calculated from the LR (Table I) are presented in Figure 5.
The score observed for phenoxyethanol at 0.5% was near zero, indicating an absence of
effect on the skin microbiota. At the use concentration in cosmetic products (1%), C acnes
and C xerosis were completely inhibited (maximum LR), while the effect on S epidermidis,
M luteus and S mitis was more moderate (Table I). The score was –28.4, indicating a strong
deleterious effect on the skin microbiota.
At low dose (0.1%), the score observed for parabens was –5.2. However, at the use
concentration of 1%, maximal LRs were observed for all bacteria, leading to a score of
–41.9. Even at a low concentration, parabens have a negative effect on the consortium. In
accordance with what was expected, these preservative substances had deleterious effects on
the consortium and thus cannot be considered friendly to the microbiota.
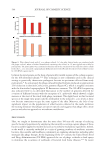
Figure 5. Evaluation of preservative substances on the consortium. The gray hatched histogram represents
the maximum score (maximum LRs).
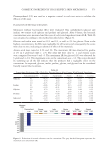
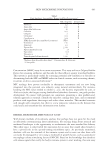
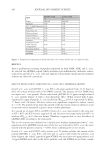
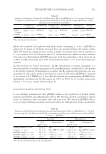
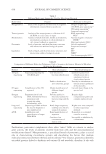
Table I
Logarithmic Reductions (LR) of Each Five Bacterial Species After Contact With Preservative Ingredients
Concentration(%) C acnes S epidermidis S mitis M luteus C xerosis
Phenoxyethanol 0.5 –0.78 –0.92 –0.49 0.16 –0.81
1.0 –8.71 –2.09 –8.32 –1.47 –7.83
Parabens 0.1 –1.40 –1.00 –1.08 –1.12 –0.66
1.0 –8.68 –8.65 –8.54 –7.93 –8.06
are also subjected to ratio variations: CI 6.9–10.4% and 7.6–12.6%, respectively. However,
the coefficients of variation on the concentrations were comprised between 2.9 and 4.2%.
Overall, the variability is low with regard to the bacterial concentrations (Figure 4B),
indicating that the consortium preparation protocol is very reproducible and can be used
to analyze the effect of cosmetic products.
EVALUATION OF PRESERVATIVE SUBSTANCES
First, two common preservatives used in cosmetic products were tested on the model, at
two concentrations: phenoxyethanol and parabens (mix of ethyl- and methyl parabens).
Scores calculated from the LR (Table I) are presented in Figure 5.
The score observed for phenoxyethanol at 0.5% was near zero, indicating an absence of
effect on the skin microbiota. At the use concentration in cosmetic products (1%), C acnes
and C xerosis were completely inhibited (maximum LR), while the effect on S epidermidis,
M luteus and S mitis was more moderate (Table I). The score was –28.4, indicating a strong
deleterious effect on the skin microbiota.
At low dose (0.1%), the score observed for parabens was –5.2. However, at the use
concentration of 1%, maximal LRs were observed for all bacteria, leading to a score of
–41.9. Even at a low concentration, parabens have a negative effect on the consortium. In
accordance with what was expected, these preservative substances had deleterious effects on
the consortium and thus cannot be considered friendly to the microbiota.
Figure 5. Evaluation of preservative substances on the consortium. The gray hatched histogram represents
the maximum score (maximum LRs).
Table I
Logarithmic Reductions (LR) of Each Five Bacterial Species After Contact With Preservative Ingredients
Concentration(%) C acnes S epidermidis S mitis M luteus C xerosis
Phenoxyethanol 0.5 –0.78 –0.92 –0.49 0.16 –0.81
1.0 –8.71 –2.09 –8.32 –1.47 –7.83
Parabens 0.1 –1.40 –1.00 –1.08 –1.12 –0.66
1.0 –8.68 –8.65 –8.54 –7.93 –8.06