590 JOURNAL OF COSMETIC SCIENCE
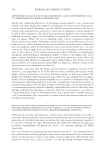
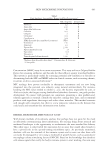
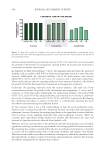
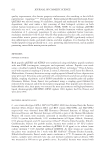
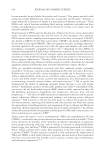
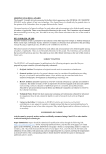
in SS reaching an abundance of 60% (increase by 1.28-fold) while Cutibacterium granulosum
abundance was decreased to 0.67% (decrease by 3-fold).
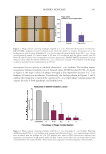
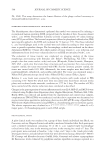
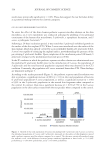
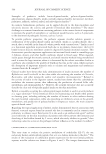
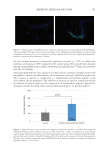
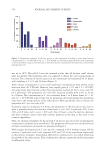
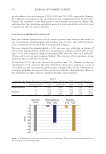
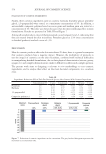
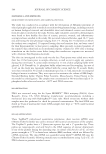
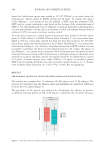
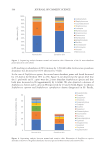
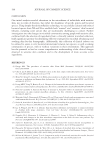
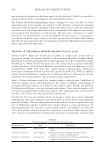
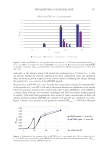
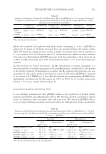
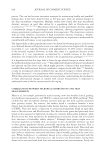
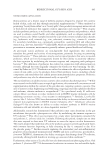
In the case of Staphylococcus genus, the second most abundant genus and found decreased
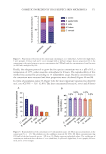
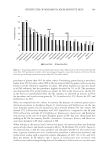
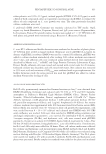
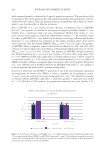
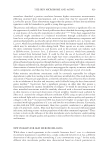
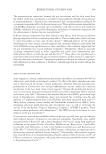
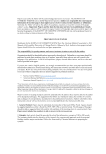
by 1.75-fold in the SS (from 39% to 22%, Figure 3), we observed at the species level that
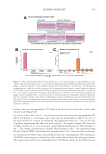
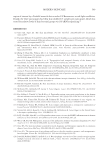
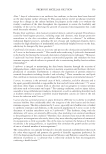
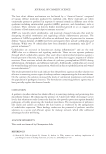
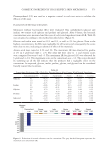
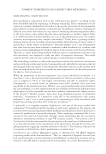
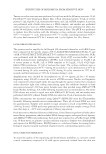
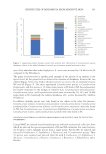
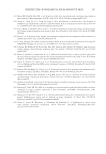
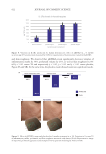
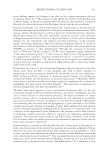
the S. epidermidis and S. capitis were the 2 most abundant Staphylococcus species and that
both were decreased in SS (approximately by 1.6-fold). We also observed a decrease of
Staphylococcus hominis and S. caprae in SS (respectively by 1.5 and 1.8-fold, Figure 4), whereas
Staphylococcus equorum and Staphylococcus saprophyiticus almost disappeared in SS. Finally,
47
60
39
22
0%
10%
20%
30%
40%
50%
60%
70%
80%
90%
100%
Normal skin Sensitive skin
Cutibacterium
Staphylococcus
Corynebacterium
Streptococcus
Lautropia
Ruminococcus
Anaerococcus
Paracoccus
Romboutsia
Bradyrhizobium
Bacillus
Acinetobacter
Actinomyces
Kocuria
Micrococcus
Figure 3. Sequencing analysis between normal and sensitive skin. Illustration of the 10 most abundant
genera present in each cohort.
19
11
13
8
9
5
3
3
3
2
0
10
20
30
40
50
60
Normal skin Sensitive skin
S.epidermidis
S.capitis
S.equorum
S.hominis
S.saprophyticus
S.caprae
S.cohnii
S.pasteuri
S.haemolyticus
S.auricularis
S.aureus
S.saccharolyticus
S.petrasii
S.lugdunensis
S.warneri
S.xylosus
S.pettenkoferi
Figure 4. Sequencing analysis between normal and sensitive skin. Illustration of Staphylococcus species
abundance relative to the global abundance bacterial species between normal and sensitive skin.
Abundance
(%)
Staphylococcus
abundance
(%)
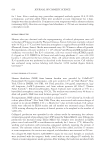
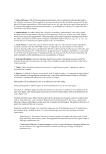
in SS reaching an abundance of 60% (increase by 1.28-fold) while Cutibacterium granulosum
abundance was decreased to 0.67% (decrease by 3-fold).
In the case of Staphylococcus genus, the second most abundant genus and found decreased
by 1.75-fold in the SS (from 39% to 22%, Figure 3), we observed at the species level that
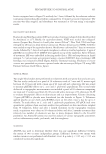
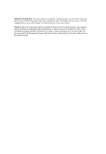
the S. epidermidis and S. capitis were the 2 most abundant Staphylococcus species and that
both were decreased in SS (approximately by 1.6-fold). We also observed a decrease of
Staphylococcus hominis and S. caprae in SS (respectively by 1.5 and 1.8-fold, Figure 4), whereas
Staphylococcus equorum and Staphylococcus saprophyiticus almost disappeared in SS. Finally,
47
60
39
22
0%
10%
20%
30%
40%
50%
60%
70%
80%
90%
100%
Normal skin Sensitive skin
Cutibacterium
Staphylococcus
Corynebacterium
Streptococcus
Lautropia
Ruminococcus
Anaerococcus
Paracoccus
Romboutsia
Bradyrhizobium
Bacillus
Acinetobacter
Actinomyces
Kocuria
Micrococcus
Figure 3. Sequencing analysis between normal and sensitive skin. Illustration of the 10 most abundant
genera present in each cohort.
19
11
13
8
9
5
3
3
3
2
0
10
20
30
40
50
60
Normal skin Sensitive skin
S.epidermidis
S.capitis
S.equorum
S.hominis
S.saprophyticus
S.caprae
S.cohnii
S.pasteuri
S.haemolyticus
S.auricularis
S.aureus
S.saccharolyticus
S.petrasii
S.lugdunensis
S.warneri
S.xylosus
S.pettenkoferi
Figure 4. Sequencing analysis between normal and sensitive skin. Illustration of Staphylococcus species
abundance relative to the global abundance bacterial species between normal and sensitive skin.
Abundance
(%)
Staphylococcus
abundance
(%)