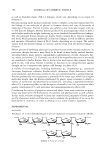
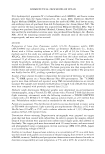
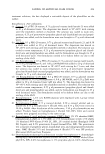
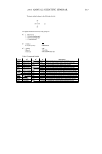
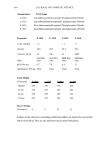
COSMECEUTICAL PROPERTIES OF LEVAN 399 via absorbance, measured at 570 nm with an ELISA reader. The cell viability was cal culated as Cell viability (%) = (OD 57 0(sample/OD 57 o(control)) X 100 in which the OD 57 o(sampl e ) refers to the absorbance at 5 70 nm of the cells treated with levan or SLS, and OD 57 occonrrol) is the absorbance at 5 70 nm of the negative control (non-treated cells). Cell proliferation test with 3-dimensional artificial skin (26,27). A dermal insert was con structed and cultured for three days in ascorbic acid-harboring DMEM supplemented with 10% FBS. The normal keratinocytes were seeded on this dermis at a density of 2 x 10⁵ cells/ml and incubated for seven days, along with DMEM supplemented with ascorbic acid (50 µg/ml) as well as 10% FBS and K-SFM (1: 1). Then, the insert medium was discarded in order to induce keratinization and was cultured for a total of five days. After new medium had been added, 10 µl of SLS (sodium lauryl sulfate) was added to each of the inserts. After four hours, samples (10 µl) of each concentration were applied to the epidermis for 24 hours. One mililiter of 0.25 mg/ml MTT was applied to the insert. After an additional four hours of incubation, the MTT solution was discarded, and the MTT formazan product was extracted with 2 ml of DMSO and measured at 5 70 nm with an ELISA reader. Anti-inflammation test with 3-D artificial skin. We also carried out an interleukin-la release assay with an ELISA kit. Before MTT was added to the well plates for the cytotoxicity assay, media were collected in order to measure the release of IL-la. We used a human IL-la ELISA kit (Pierce, Rockford, IL), and E. coli-delivered recombinant human IL-la was utilized as a standard. After the human IL-la antibody was allowed to react with the sample at room temperature, the sample was treated with biotin conjugated secondary antibody. Streptavidin-HRP (horseradish peroxidase) was applied for 30 minutes, followed by treatment with trimethylbenzidine solution. The absorbance was measured at 45 0 nm using on ELISA reader. RES UL TS AND DISCUSSION CHARACTERIZATION OF LEV AN In order to determine precisely the structure of levan, we conducted a 13 C-NMR experiment using a Varian-Mercury Plus 400 spectrometer. The 13 C-NMR spectra of the levan generated by Zymomonas mobilis exhibited six primary peaks at 59.9, 63.5, 75.3, 76.3, 80.4, and 104.2 ppm. (Table I). These chemical shift values were quite similar to those of levan, much more than to those of inulin. We also observed trace peaks, but these were similar to those of inulin. Therefore, our results indicated that the structure of the polysaccharide generated by Zymomonas mobilis is primarily reminiscent of levan and is characterized by � 2➔6 linkages, with branches of� 2➔ 1 linkages (22). The measured weight-average molecular weight, as described above, was 2.25 x 10⁶ , and the polydispersity was measured to be 2.759. PAR TI CLE SIZE MEASUREMENT Levan partially forms nanoparticles in water. The distribution of the particle size of these

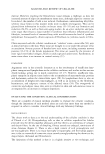
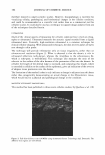
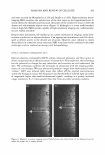
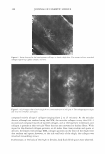
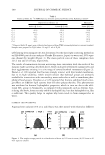
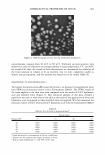
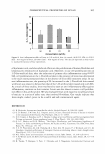
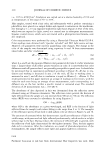
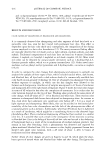
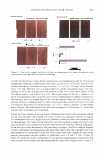
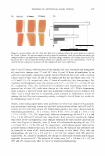
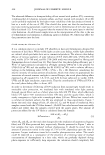
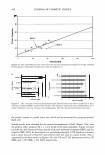
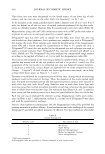
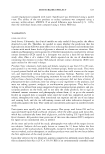
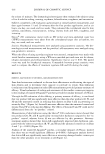
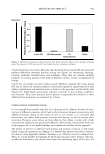
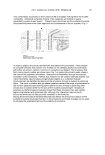
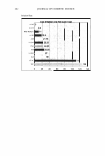
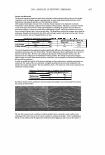
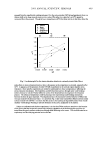
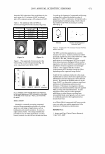
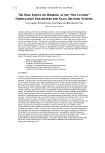
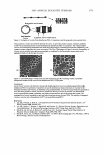
400 JOURNAL OF COSMETIC SCIENCE Table I Chemical Shifts for 13C-NMR Spectra of Inulin and Levan Produced by Zymomonas mobilis* C-1 C-2 C-3 C-4 C-5 C-6 Reported in reference 22 Inulin ([) 2➔ l) 60.9 103.3 77.0 74.3 81.1 62.2 Levan ([) 2➔6) 5 9.9 104.2 76.3 75.2 80.3 63.4 Measured Levan ([) 2➔6) 5 9.9 104.2 76.3 75.3 80.4 63.5 * Chemical shifts (o, ppm) were calibrated and reported from TMS (tetramethylsilane) as internal standard. Samples were prepared in D20 (about 10 mg/0.5 ml of D 2 0). self-forming levan nanoparticles was determined via the laser-light-scattering method on an ELS-8000 particle-size analyzer (Otsuka Electronics, Japan) in water and 20% aque ous ethanol (by weight) (Figure 1). The mean particle sizes of these complexes were 224.3 nm and 251.8 nm, respectively. The results of transmission electron microscopy were concordant with the results of the dynamic light scattering described above, which indicated self-formed nanoparticles and their agglomerates existing in a size range of several hundred nanometers (Figure 2). Demel et al. (28) reported that fructans strongly interact with lipid model membranes, due to its high solubility, which would indicate that hydroxyl groups are primarily available for interactions with surrounding water molecules as well as membrane phos pholipid head groups. Vereyken et al. (29) reported that fructans exhibited much stron ger effects on different lipid systems than did other polysaccharides. This phenomenon was attributed to fructans' hydrophobic properties, which in turn are due to the addi tional CH 2 group in furanosides, as compared with pyranosides such as dextran. Con sidering the above, levan not only exhibits hydrophilicity, but also hydrophobicity, like a surfactant. This quality helps to explain why levan tends to form nanoparticles in water. ST ABILITY TEST IN ETHANOL Aqueous levan solution (5 % on a solid basis) was then mixed with ethanol at different SIZE ,,, DISTRIBUTION c weight 10 8 6 2 0 . " . . . . . . . . . . " 124 177 252 (a) AUT02 9.4E+01 t:ln(D) (11nm) 360 (0nm) SIZE DISTRIBUTION ( weight ) AUT02 (%) 10 92E+01 8 .. ..L 6 dln(D) 4 (1mm) 2 ... 90 125 179 256 367 (OMI) (b) Figure 1. The weight average particle size distribution of levan: (a) 5% levan in water (b) 5% levan in 20 wt% aqueous ethanol.
Purchased for the exclusive use of nofirst nolast (unknown)
From: SCC Media Library & Resource Center (library.scconline.org)