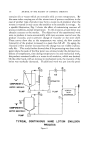
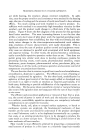
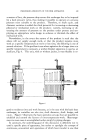
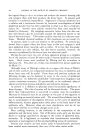
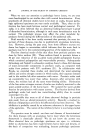
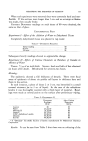
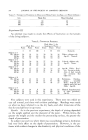
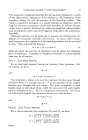
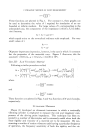
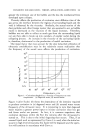
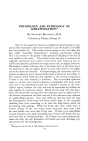
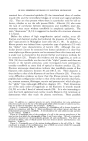
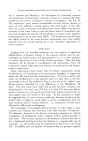
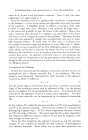
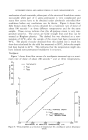
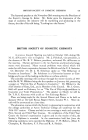
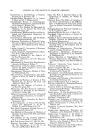
INTERPRETATIONS AND APPLICATIONS OF FLOW MEASUREMENTS 605 t PROGRAMS FLOW CURVES G2 G G• I •8'• t --'- T---'- Gi Figure 3.--Programs and typical flow curves for time- dependent materials. viscometer where the same sample is maintained throughout the complete measurement. In a capillary-tube viscometer, the sample is usually ex- pelled after each point measurement, thus special instrumentation is re- quired to obtain such flow curves for time-dependent materials with this type of viscometer. The pronounced difference between the up- and down-curves indicates that the flow properties are not only shear- but also time-dependent. A different flow curve is obtained indicating further de- crease in flow structure when the material is sheared for a certain time at a constant rate of shear before the rate of shear is decreased for the flow curve measurement. Such a behavior of a time-dependent material indicates either permanent breakdown or thixotropic behavior. A thixotropic material will recover its original structure when left undisturbed for a period of time. Thus a second up- and down-flow curve is required to classify the flow behavior of such materials. For a time-dependent material each point measurement is affected, not only by the shear condition which exists during this meas- urement, but also by all those shear conditions which preceded this meas- urement. Therefore, flow curves of time-dependent materials are mean- ingful only if either the rate of shear or the shearing stress is increased or decreased at a constant rate. The sequence of up- and down-flow curves which are needed for the interpretation of the flow behavior depends on the type of material and on the flow information that is required. Such programmed flow curves can frequently be obtained by controlled manual operation. However, for highly time-dependent materials where the flow properties change very rapidly with time and shear rate, manual control is difficult and often inadequate in speed and sensitivity. For this

606 JOURNAL OF THE SOCIETY OF COSMETIC CHEMISTS reason the rotational concentric-cylinder ¾iscometer (5, 6) which was built at the NACA Lewis Flight Propulsion Laboratory was provided with automatic controls for increasing and decreasing the applied rates of shear at selected constant rates. In addition, two automatic programs to pro- duce two sequences of up- and down-flow curves were provided. These programs are shown to the left in Fig. 3. The same programs could be used for manual control. The first part of Program B (one up- and down-flow curve) can be used to determine if a material of unknown flow behavior is time dependent. If the up- and down-flow curves coincide the material is time dependent and its flow behavior and flow properties can be determined without further measurement. For a time-dependent material a second similar up- and down-flow curve should be measured after the material had re- mained at rest for a sufficient time to decide if the materials show per- manent breakdown, thixotropic behavior or both. Flow properties analogous to the ones described for only shear-dependent non-Newtonian materials can then be determined for different shear and time conditions. In the case of purely thixotropic materials, the area of the loop can be used as a relative measure of the degree of thixotropic behavior if the measuring conditions are standardized (7). If the material is of thixo- tropic plastic character, further measurements can be made to obtain one or two coefficients of thixotropic breakdown. It has been found (7) that both coefficients are constant for any one such material, if the breakdown with time and shear is entirely of thixotropic character, that means where the structure is completely recoverable upon rest. The coefficient 214, whlch gives an indication of the change in plastic viscosity with rate of shear can be obtained by using Program A. This program yields the sequence of flow curves as shown to the right of Program A. Two plastic viscosities U• and U.2 are obtained from the inverse slopes of the two straight line down curves. It is important that the maximum rates of shear G• and G2 of those two down curves fall on the same up curve. There- fore, care has to be taken to continue the up curve at G1 at the same r that had been previously obtained at G1. This can be assisted by giving the sample time to rebuild some of its structure before increasing the rate of shear to G1 for the second time. (The dashed lines in the programs 'indicate that those speed increases are not usually recorded.) The co- efficient of thixotropic breakdown M is then calculated as u• - u.• M - (9) In The other coefficient B, which gives an indication of the change in plastic viscosity with the time that a constant rate of shear is applied, can be obtained by using Program B. This program yields the sequence of
Purchased for the exclusive use of nofirst nolast (unknown)
From: SCC Media Library & Resource Center (library.scconline.org)