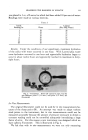
INTERPRETATIONS AND APPLICATIONS OF FLOW MEASUREMENTS 615 appearance of the connected structure throughout the microscope field. Flow curves were measured for both suspensions. They indicated thixo- tropic plastic flow behavior, so that a U andf could be calculated for each down curve. These flow properties not only predicted the indicated change but provided a quantitative evaluation. On addition of the water, the yield value increase was about tenfold the plastic viscosity change was comparatively small. The flow curves also indicated that the addition of water increased the degree of thixotropic behavior of the suspension. The coefficient of thixotropic breakdown /14 almost tripled. Since the flow properties are that sensitive to changes in manufacture the flow measurement has become one of the most important and useful tools for product control purposes. Transport in Pipelines In industrial manufacture and application, materials such as non- NewtonJan cosmetics are frequently transported through pipeline sys- tems. The pressure losses suffered during the passage will determine the design of the pipelines. These pressure losses can be calculated if the flow properties of the materials and the mean velocity in the pipeline are known. The pressure loss in a pipeline system is given as •P = p •- • + CL (12) The transition-loss coefficient CL is zero for straight pipelines and can be assigned different constant values for different pipe transitions (1, 13). The friction factor q can be obtained for Newtonian, Bingham plastic, pseudoplastic and dilatant materials from a generalized friction diagram (1,14). The friction diagram for NewtonJan fluids is well known (15). Since q is a function of/• only, the pressure loss caused by transferring a New- tonian material through a pipeline of given pipe diameter and at a given velocity is uniquely determined by the viscosity/• of the liquid. For a Bingham plastic material in laminar flow, the friction factor is a fun6tion of the plastic viscosity U and the yield valuef (1, 14, 16). These two flow properties are independent of the rate of shear in the pipeline and thus it is not necessary to know this shear rate to calculate the pres- sure loss caused by the passage of these materials. For a pseudoplastic and dilatant material in laminar flow the friction factor is a function of the structure number N and the apparent viscosity •, which both have to be obtained for the rate of shear to which the ma- teriial is subjected in the pipeline. Therefore, to calculate the pressure losses caused by the passage of these materials, it is necessary to know the shear rate in the pipeline (1, 14, 17). For non-Newtonian materials in turbulent flow the friction factor is a

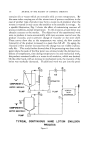
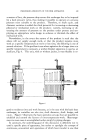
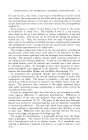
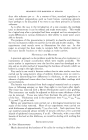
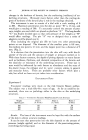
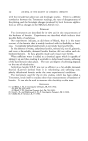
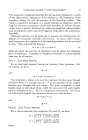
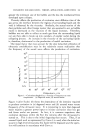
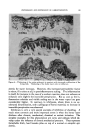
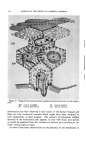
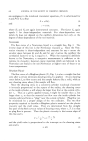
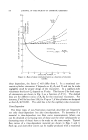
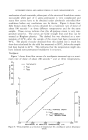
616 JOURNAL OF THE SOCIETY OF COSMETIC CHEMISTS 16xlO 4 . / •}CALCULATED / /cc) / TURBULENT FLOW• / 7 IU: 0.26 POISE' / / /f=zo / / TO 50 POISES •2 TEHP= Z7*C o• 5 I0 15 x 104 I I I00 200 300 x 104 • • PRESSURE LOSS, •p, DYNES/CH 2 ],•r½ss•r½ losses {n oncAnch p¾½En½s o• E/• = 3• •or a function of U and •e only. Whenever the apparent viscosity is to be de- termined at a high shear rate as is always the case in turbulent flow, an apparent viscosity extrapolated to infinite rate of shear can be used. This viscosity can be found from a linear plot of reciprocal rate of shear against apparent viscosity (18) by extrapolation to l/G=0. In Fig. 11 the squared mean velocity in the pipeline is plotted against the pressure loss for a Newtonian, Bingham plastic and pseudoplastic material. The mean velocity is obtained from the flow rate which is usually known. A few pressure loss measurements were obtained (13) for a Bingham plastic suspension of titanium dioxide particles in water (t•= 1.18 g./cc., U=0.26 poise and f--320 dynes/cm. •) in one-inch pipelines of L/D=34. The points indicate the experimental pressure losses. The lines represent the calculated pressure losses for the same pipeline. For comparison the NewtonJan liquid was chosen to have the same viscosity and density as the Bingham plastic. The pseudoplastic line is calculated for the toothpaste flow curve which had been obtained at 27øC., Fig. 7. Since the Newtonian fluid and the Bingham plastic material have the same viscosity, it is interesting to compare their flow behavior in the pipe- line. As can be seen turbulent flow starts at a considerably lower flow rate in the case of the Newtonian fluid than for the Bingham plastic ma- terial. The large displacement of the two curves indicates that in laminar
Purchased for the exclusive use of nofirst nolast (unknown)
From: SCC Media Library & Resource Center (library.scconline.org)