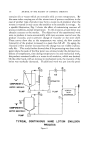
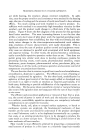
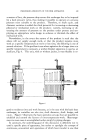
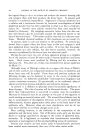
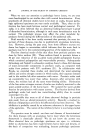
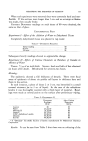
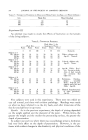
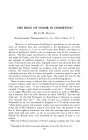
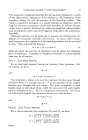
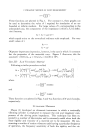
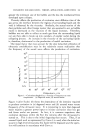
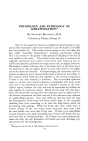
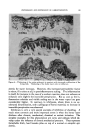
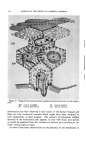
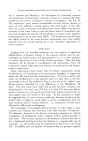
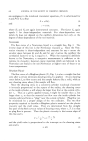
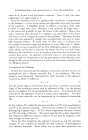
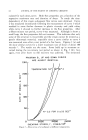
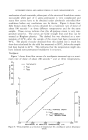
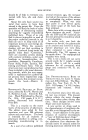
INTERPRETATIONS AND APPLICATIONS OF FLOW MEASUREMENTS 609 an all-purpose cream and on a toothpaste. The flow curves were obtained directly by recording the instantaneous torque values obtained from a strain gage transducer and the instantaneous values of rotational speed obtained from a tachometer on an X-¾ recorder. The recorded values are accurate within 1 per cent of full scale yielding viscosity measurements within 4 per cent. In this viscometer the separations between cylinders were sufficiently small to permit the use of the midpoint radius to calculate G and r, and the cylinder sets were designed so that C is between 0.95 and 1.05 for most samples to be tested. Therefore, C can be assumed to be equal to 1 for most measurements. All dimensions and more details of this vis- cometer can be found in (5). All-Purpose Cream Flow curves of the all-purpose cream are shown in Fig. 4. They were measured according to Program A, up to a maximum rate of shear of about 1600 seconds-L Curve 1 shows large differences between the up- and down-curves indicating that the cream is time dependent. The down- curves were treated as Bingham plastic curves and a U and oe was cal- 2'00 rTEMP. 44 ø 24 ø // IOO 5o 32 ø 24 ø C I POISES DYNES/CM 2 I i I 0 500 I000 1500 SHEARING STRESS, r, DYNES/CM 2 Figure 6.--Down flow curves of an all-purpose cream after complete breakdown at different temperatures.

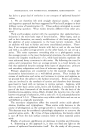
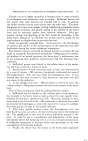
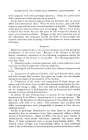
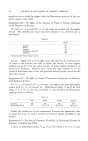
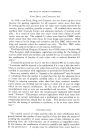
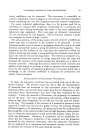
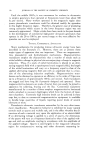
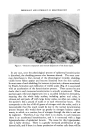
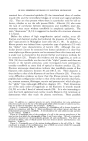
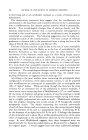
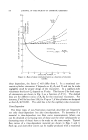
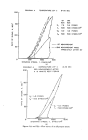
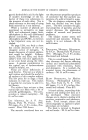
610 JOURNAL OF THE SOCIETY OF COSMETIC CHEMISTS culated for each down-curve. Both flow properties are a function of the respective maximum rate and duration of shear. To study the time- dependency of this cream subsequent flow curves were obtained. Curve 2 was measured immediately following the measurement of curve 1 which resulted in some further decrease in plastic viscosity and yield value while curve 3 showed no further decrease in the flow properties. After a fifteen-minute rest period, curve 4 was measured. Although it shows a small loop, the flow properties did not increase. This indicates that only some of the structure is recoverable and the cream cannot be treated as a purely thixotropic material especially since a curve similar to curve 4 was measured even after a rest period of a few hours. Figures 5 (a) and (b) show similar curves for a lower maximum rate of shear of about 180 seconds -•. The results are the same. Some build up in structure oc- curred during the ten-minute rest period as shown in Fig. 5 (b) but, again, even after hours no full recovery was achieved. The structural PROGRAM B, UP AND DOWN CURVES ARE ALMOST IDENTICAL 25O i,i 2OO 150 IO0 TEMPERATURE 50 ø 5O N = 2.2 FOR G _,55 SEC -• I I 0 5000 I0000 15000 SHEARING STRESS, T, DYNES/CM 2 Figure 7.--Flow curves of a toothpaste at didrent temperatures.
Purchased for the exclusive use of nofirst nolast (unknown)
From: SCC Media Library & Resource Center (library.scconline.org)