451 DELIVERING SUSTAINABLE SOLUTIONS TO IMPROVE WELLBEING
against MBNL1 protein (Sigma-Aldrich, St. Louis, MO, USA) in a 5% BSA solution for 2
hours. After the incubation time, cells were washed and incubated with a 1/200 dilution of
the secondary antibody (Alex Fluor 488) in a 5% BSA solution for 1 hour. Finally, cells were
washed three times and stained with a DAPI mount solution for nuclei detection. MBNL1
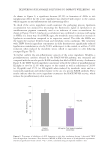
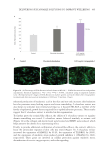
protein quantification was measured as fluorescence intensity of MBNL1 normalized by
the number of nuclei for each condition using a confocal microscope (Operetta® confocal
microscope, PerkinElmer, Inc., Waltham, MA, USA) with the Alexa Fluor 488 Green
channel (Ex is 460-490 nm/Em is 500-550 nm). Results are expressed as a variation of
relative MBNL1 protein levels (%)with respect to the control condition (without electrical
stimulation) and the electrical stimulated condition.
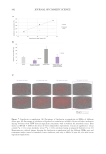
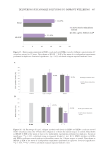
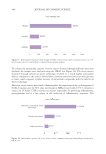
DETECTION OF EDA-FIBRONECTIN MARKER ON HUMAN DERMAL FIBROBLASTS
Cells coming from a collagen-gel contraction assay (see the following section) were used
to detect an EDA-fibronectin marker. The cells included in that assay were the control
condition (without electrical stimulation), electrical stimulated cells, and tetrapeptide-1
treated cells at 0.01 mg/mL. 3D collagen gels were previously digested using a collagenase
treatment and were fixed on 12-well plates into coverslips. The cells were then washed
twice with PBS (Sigma-Aldrich, St. Louis, MO, USA) and permeabilized with 0.5% Triton
X-100 (Sigma-Aldrich, St. Louis, MO, USA)) for 10 minutes. Finally, cells were washed
three times with PBS again prior to fluorescent labeling of the target protein. Samples were
blocked with 4% BSA (Sigma-Aldrich, St. Louis, MO, USA)) in PBS for 2 hours. After this
step, cells were incubated with an antifibronectin [IST-9] mouse monoclonal antibody at
1:500 (ab6328) (ABCAM) and diluted in 4% BSA in PBS for 2 hours. After the incubation
time, cells were washed again with PBS three times and secondary Alexa Fluor® Thermo
Fisher Scientific, Waltham, MA, USA) 488 goat antimouse IgG (H +L) antibody (1:500
Life Technologies, green fluorescence emission dye) was added and cells were incubated
for 1 hour in the dark. After three washes with PBS, the nuclei of the cells were stained,
and coverslips were mounted with a ProLong Gold antifade reagent with DAPI (Life
Technologies, Carlsbad, CA, USA). The fluorescence intensity signal was determined using
an Operetta® confocal microscope (PerkinElmer, Inc, Waltham, MA, USA) using Alexa
Fluor 488 Green channel (Ex is 460-490 nm/Em is 500-550 nm) and was corrected by the
determining the number of nuclei for each condition. Four independent experiments were
analyzed.
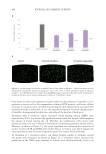
IN VITRO COLLAGEN-GEL CONTRACTION ASSAY
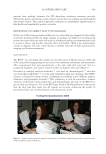
Human dermal fibroblasts were seeded in 60 mm Petri dishes prepared for the electrical
stimulation. After an overnight period to allow cell attachment in the conditions of
treatment, tetrapeptide-1 was added to the culture media at a concentration of 0.01 mg/
mL for 24 hours (in duplicate experiments). The peptide was also maintained in the
culture media for the 3D cultures thus, the total treatment time was 48 hours. Control
experiments (with and without electrical stimulation) were performed in the same way
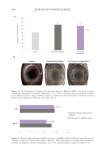
but without adding the tetrapeptide-1. Therefore, there were three groups in the study:
control without electrical stimulation, control with 1 hour of electrical stimulation, and
the peptide treatment (tetrapeptide-1 at 0.01 mg/mL). Cell suspensions for each of the
conditions to seed were diluted in each corresponding medium with the peptide. The
against MBNL1 protein (Sigma-Aldrich, St. Louis, MO, USA) in a 5% BSA solution for 2
hours. After the incubation time, cells were washed and incubated with a 1/200 dilution of
the secondary antibody (Alex Fluor 488) in a 5% BSA solution for 1 hour. Finally, cells were
washed three times and stained with a DAPI mount solution for nuclei detection. MBNL1
protein quantification was measured as fluorescence intensity of MBNL1 normalized by
the number of nuclei for each condition using a confocal microscope (Operetta® confocal
microscope, PerkinElmer, Inc., Waltham, MA, USA) with the Alexa Fluor 488 Green
channel (Ex is 460-490 nm/Em is 500-550 nm). Results are expressed as a variation of
relative MBNL1 protein levels (%)with respect to the control condition (without electrical
stimulation) and the electrical stimulated condition.
DETECTION OF EDA-FIBRONECTIN MARKER ON HUMAN DERMAL FIBROBLASTS
Cells coming from a collagen-gel contraction assay (see the following section) were used
to detect an EDA-fibronectin marker. The cells included in that assay were the control
condition (without electrical stimulation), electrical stimulated cells, and tetrapeptide-1
treated cells at 0.01 mg/mL. 3D collagen gels were previously digested using a collagenase
treatment and were fixed on 12-well plates into coverslips. The cells were then washed
twice with PBS (Sigma-Aldrich, St. Louis, MO, USA) and permeabilized with 0.5% Triton
X-100 (Sigma-Aldrich, St. Louis, MO, USA)) for 10 minutes. Finally, cells were washed
three times with PBS again prior to fluorescent labeling of the target protein. Samples were
blocked with 4% BSA (Sigma-Aldrich, St. Louis, MO, USA)) in PBS for 2 hours. After this
step, cells were incubated with an antifibronectin [IST-9] mouse monoclonal antibody at
1:500 (ab6328) (ABCAM) and diluted in 4% BSA in PBS for 2 hours. After the incubation
time, cells were washed again with PBS three times and secondary Alexa Fluor® Thermo
Fisher Scientific, Waltham, MA, USA) 488 goat antimouse IgG (H +L) antibody (1:500
Life Technologies, green fluorescence emission dye) was added and cells were incubated
for 1 hour in the dark. After three washes with PBS, the nuclei of the cells were stained,
and coverslips were mounted with a ProLong Gold antifade reagent with DAPI (Life
Technologies, Carlsbad, CA, USA). The fluorescence intensity signal was determined using
an Operetta® confocal microscope (PerkinElmer, Inc, Waltham, MA, USA) using Alexa
Fluor 488 Green channel (Ex is 460-490 nm/Em is 500-550 nm) and was corrected by the
determining the number of nuclei for each condition. Four independent experiments were
analyzed.
IN VITRO COLLAGEN-GEL CONTRACTION ASSAY
Human dermal fibroblasts were seeded in 60 mm Petri dishes prepared for the electrical
stimulation. After an overnight period to allow cell attachment in the conditions of
treatment, tetrapeptide-1 was added to the culture media at a concentration of 0.01 mg/
mL for 24 hours (in duplicate experiments). The peptide was also maintained in the
culture media for the 3D cultures thus, the total treatment time was 48 hours. Control
experiments (with and without electrical stimulation) were performed in the same way
but without adding the tetrapeptide-1. Therefore, there were three groups in the study:
control without electrical stimulation, control with 1 hour of electrical stimulation, and
the peptide treatment (tetrapeptide-1 at 0.01 mg/mL). Cell suspensions for each of the
conditions to seed were diluted in each corresponding medium with the peptide. The