370 JOURNAL OF COSMETIC SCIENCE
disorders compared with control subjects without cutaneous disorders (4.1 ± 2.51 versus
3.5 ± 2.3, respectively, p =0.0019).57 These authors found that pain and pruritus were
good predictors of sleep disturbance (OR 1.7, 95% CI 1.4–2.0, p 0.0001, and 1.6, 95%
CI 1.3–2.0, p 0.0001, respectively).
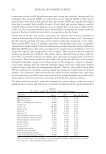
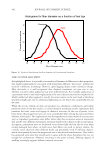
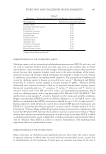
Misery and colleagues conducted a survey among five different countries.48 Participants were
asked to rate the severity of sleep disorders and unpleasant skin sensations on numerical
scales, with 0 being no disturbance and 10 being the maximum. A score of 3 was considered
mild, between 3 and ≤7 was considered moderate, and ≥7 was considered severe. Among
the 10,743 participants 8,296 subjects reported sleep disorders. Approximately half of these
(4,295 or 51.77%) also reported SSS. Subjects with SSS had significantly worse (higher) scores
for sleep disorders (3.6 out of 10) compared with subjects without sensitive skin (1.6 out of
10) (p 0.001).48 Xiao and colleagues found similar results in a China study, which included
22,085 women.34 These authors reported that SSS was more likely in individuals who slept
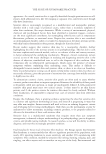
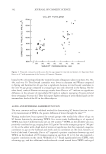
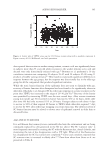
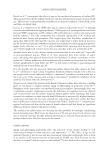
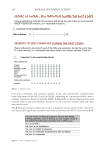
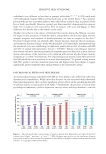
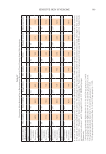
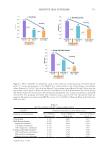
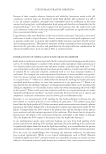
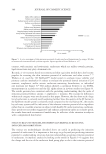
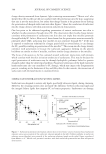
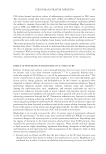
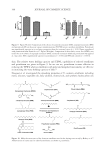
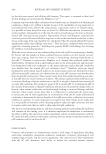
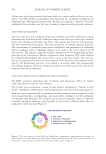
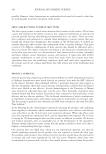
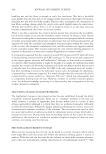
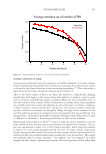
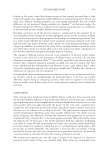
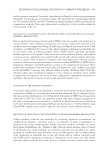
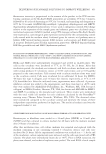
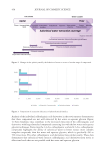
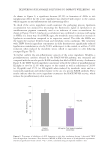
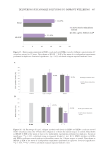
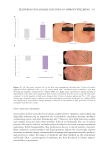
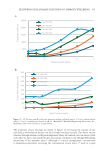
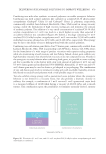
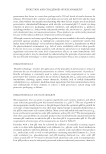
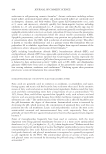
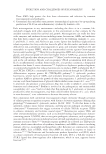
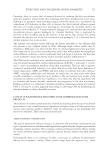
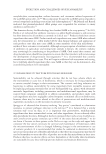
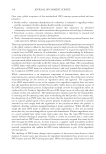
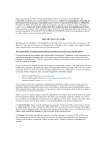
Figure 3. Some product categories reported to trigger SSS symptoms. Responders in the Cincinnati study
were asked if a variety of categories of cosmetics, personal care products, and household products had ever
caused adverse reactions to their skin.35,36 For all product categories, the proportion of individuals with SSS
who responded positively was significantly higher than the number of individuals without SSS who responded
positively. (*=p 0.00001).
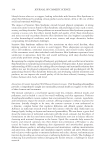
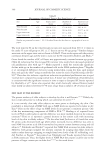
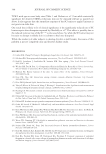
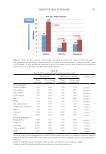
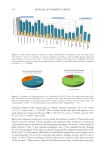
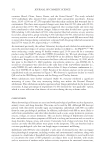
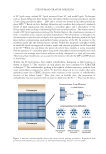
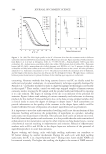
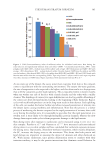
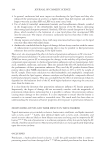
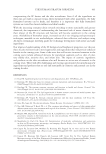
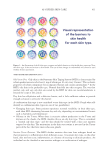
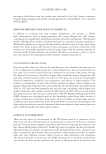
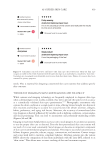
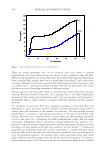
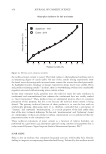
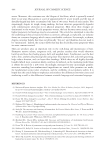
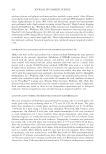
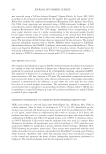
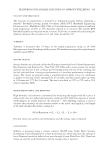
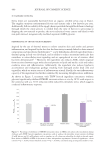
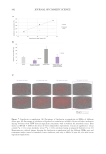
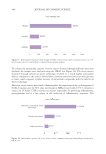
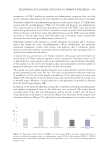
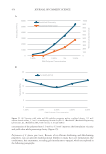
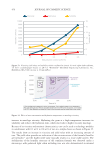
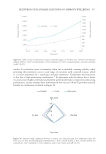
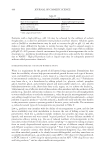
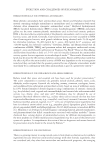
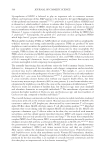
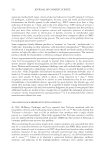
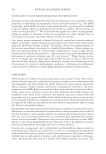
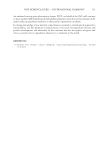
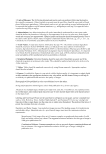
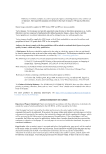
Figure 4. Consumer and shopping practices for individuals with SSS. In the Cincinnati study, responders
were asked about specific shopping practices. Compared to the group who did not have SSS, the subjects with
SSS were far more likely to: (A) look for skin related claims on products (such as, “safe for sensitive skin” and
“hypoallergenic”) (OR =5.3) and (B) avoid specific ingredients when shopping (OR =5.2).
disorders compared with control subjects without cutaneous disorders (4.1 ± 2.51 versus
3.5 ± 2.3, respectively, p =0.0019).57 These authors found that pain and pruritus were
good predictors of sleep disturbance (OR 1.7, 95% CI 1.4–2.0, p 0.0001, and 1.6, 95%
CI 1.3–2.0, p 0.0001, respectively).
Misery and colleagues conducted a survey among five different countries.48 Participants were
asked to rate the severity of sleep disorders and unpleasant skin sensations on numerical
scales, with 0 being no disturbance and 10 being the maximum. A score of 3 was considered
mild, between 3 and ≤7 was considered moderate, and ≥7 was considered severe. Among
the 10,743 participants 8,296 subjects reported sleep disorders. Approximately half of these
(4,295 or 51.77%) also reported SSS. Subjects with SSS had significantly worse (higher) scores
for sleep disorders (3.6 out of 10) compared with subjects without sensitive skin (1.6 out of
10) (p 0.001).48 Xiao and colleagues found similar results in a China study, which included
22,085 women.34 These authors reported that SSS was more likely in individuals who slept
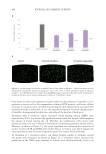
Figure 3. Some product categories reported to trigger SSS symptoms. Responders in the Cincinnati study
were asked if a variety of categories of cosmetics, personal care products, and household products had ever
caused adverse reactions to their skin.35,36 For all product categories, the proportion of individuals with SSS
who responded positively was significantly higher than the number of individuals without SSS who responded
positively. (*=p 0.00001).
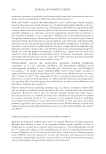
Figure 4. Consumer and shopping practices for individuals with SSS. In the Cincinnati study, responders
were asked about specific shopping practices. Compared to the group who did not have SSS, the subjects with
SSS were far more likely to: (A) look for skin related claims on products (such as, “safe for sensitive skin” and
“hypoallergenic”) (OR =5.3) and (B) avoid specific ingredients when shopping (OR =5.2).