392 JOURNAL OF COSMETIC SCIENCE
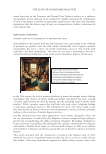
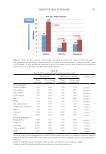
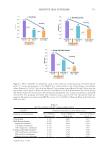
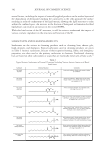
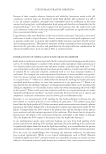
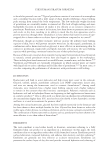
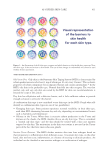
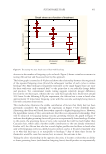
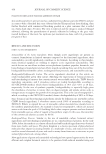
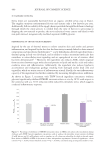
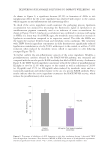
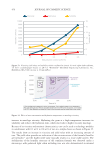
components in their model formulations were not causing any irritation. Interestingly, the
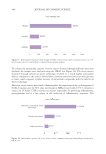
emulsifiers that increased TEWL in normal skin in fact reduced TEWL in SLS treated
irritated skin. Note that in SLS irritated skin, the baseline TEWL was significantly higher
than that in normal skin possibly because of both lipid and protein damage, and the
emulsifier that perturbed skin lipid structure in normal skin resulted in an improvement
in this case. It is not unreasonable to expect added lipids to strengthen an already weakened
barrier or fluidize a healthy barrier both by incorporating into the bilayer.
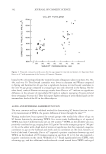
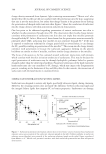
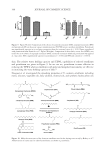
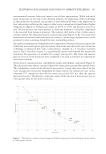
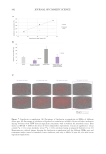
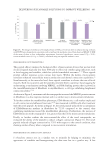
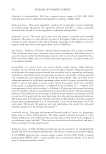
Unlike that of anionic and cationic surfactants, the inherent skin irritation potential of
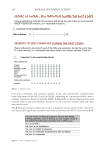
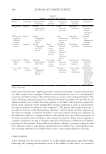
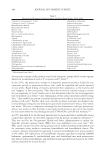
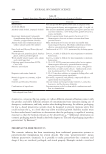
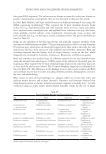
nonionic surfactants has not been investigated in detail. Recently, Lemery et al.73 investigated
the skin toxicity potential of 4 ionic and 14 nonionic surfactants using four in vitro assays.
These include MTT assay, cell viability, and release of biomarkers such as IL1 α (primary
inflammation marker) and IL-8 (delayed inflammation marker) using Reconstructed Human
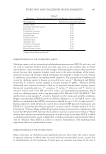
Epidermis (RHE) tissues. The tissue was exposed to 14 surfactants as emulsifiers at 3% level
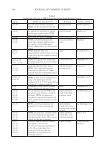
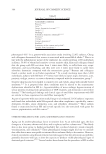
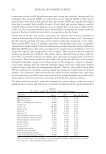
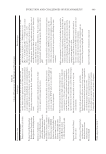
along with caprylic/capric triglycerides as the oil phase. Their results for the two irritation
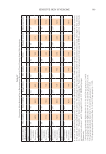
markers are reproduced in Table II. The authors chose a threshold value of three, with less
than three as relatively mild and the higher ones indicating increasing levels of potential
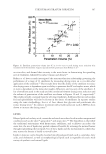
for irritation. These results show that the soluble ionic surfactants (SLS and cetyl trimethyl
ammonium bromide), irrespective of their nature of the charge (i.e. cationic or anionic),
caused more damage than the relatively insoluble longer chain ionic surfactants (sodium
stearoyl lactylate and distearyl diammonium chloride). The low value of IL8 release from
SLS was attributed to cell death occurring rapidly preventing any further release of delayed
markers. The differences observed between the soluble and the insoluble ionic surfactants
are not surprising as insoluble surfactants will not have enough monomers or micelles in the
aqueous phase to bind to proteins or intercalate with lipids from aqueous systems.
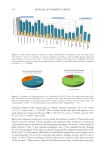
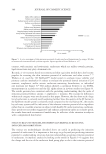
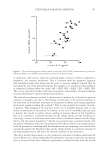
The above results for nonionic surfactants showed that several nonionic surfactants caused
significant IL1-α release and IL8 release. A detailed examination of the results showed that
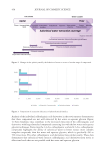
Table II
IL-1a, IL-8, and IL-8/IL-1a Ratios for Different Surfactants
Surfactant IL-1α IL-8 Ratio IL-8/IL-1α
PEG-20 stearate 0.985 0.787 0.799
PEG-100 stearate 0.735 0.985 1.341
PEG-25 hydrogenated castor oil 6.860 5.512 0.804
Laureth-23 3.105 0.484 0.156
Ceteth-10 90.400 4.250 0.047
Steareth-100 6.363 5.453 0.857
Oleth-20 34.359 3.111 0.091
Beheneth-25 24.592 11.502 0.468
Polyoxyethylene sorbitan laurate 0.801 0.441 0.55
Polyoxyethylene sorbitan stearate 0.865 0.612 0.707
Polyoxyethylene sorbitan oleate 0.784 0.866 1.105
Sucrose laurate 7.113 9.109 1.281
Sucrose stearate 1.404 0.791 0.563
Sucrose oleate 1.073 0.948 0.883
Sodium lauryl sulfate 22.121 0.810 0.037
Sodium stearoyl lactylate 0.582 3.407 5.85
Distearyldimonium chloride 1.242 0.648 0.522
Cetyl trimethylammonium chloride 6.326 0.172 0.027
*IL-1a and IL-8 above the threshold of 3 given from the frequency distribution are given in
bold characters. Table reproduced from Lemery et al.73
components in their model formulations were not causing any irritation. Interestingly, the
emulsifiers that increased TEWL in normal skin in fact reduced TEWL in SLS treated
irritated skin. Note that in SLS irritated skin, the baseline TEWL was significantly higher
than that in normal skin possibly because of both lipid and protein damage, and the
emulsifier that perturbed skin lipid structure in normal skin resulted in an improvement
in this case. It is not unreasonable to expect added lipids to strengthen an already weakened
barrier or fluidize a healthy barrier both by incorporating into the bilayer.
Unlike that of anionic and cationic surfactants, the inherent skin irritation potential of
nonionic surfactants has not been investigated in detail. Recently, Lemery et al.73 investigated
the skin toxicity potential of 4 ionic and 14 nonionic surfactants using four in vitro assays.
These include MTT assay, cell viability, and release of biomarkers such as IL1 α (primary
inflammation marker) and IL-8 (delayed inflammation marker) using Reconstructed Human
Epidermis (RHE) tissues. The tissue was exposed to 14 surfactants as emulsifiers at 3% level
along with caprylic/capric triglycerides as the oil phase. Their results for the two irritation
markers are reproduced in Table II. The authors chose a threshold value of three, with less
than three as relatively mild and the higher ones indicating increasing levels of potential
for irritation. These results show that the soluble ionic surfactants (SLS and cetyl trimethyl
ammonium bromide), irrespective of their nature of the charge (i.e. cationic or anionic),
caused more damage than the relatively insoluble longer chain ionic surfactants (sodium
stearoyl lactylate and distearyl diammonium chloride). The low value of IL8 release from
SLS was attributed to cell death occurring rapidly preventing any further release of delayed
markers. The differences observed between the soluble and the insoluble ionic surfactants
are not surprising as insoluble surfactants will not have enough monomers or micelles in the
aqueous phase to bind to proteins or intercalate with lipids from aqueous systems.
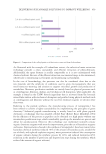
The above results for nonionic surfactants showed that several nonionic surfactants caused
significant IL1-α release and IL8 release. A detailed examination of the results showed that
Table II
IL-1a, IL-8, and IL-8/IL-1a Ratios for Different Surfactants
Surfactant IL-1α IL-8 Ratio IL-8/IL-1α
PEG-20 stearate 0.985 0.787 0.799
PEG-100 stearate 0.735 0.985 1.341
PEG-25 hydrogenated castor oil 6.860 5.512 0.804
Laureth-23 3.105 0.484 0.156
Ceteth-10 90.400 4.250 0.047
Steareth-100 6.363 5.453 0.857
Oleth-20 34.359 3.111 0.091
Beheneth-25 24.592 11.502 0.468
Polyoxyethylene sorbitan laurate 0.801 0.441 0.55
Polyoxyethylene sorbitan stearate 0.865 0.612 0.707
Polyoxyethylene sorbitan oleate 0.784 0.866 1.105
Sucrose laurate 7.113 9.109 1.281
Sucrose stearate 1.404 0.791 0.563
Sucrose oleate 1.073 0.948 0.883
Sodium lauryl sulfate 22.121 0.810 0.037
Sodium stearoyl lactylate 0.582 3.407 5.85
Distearyldimonium chloride 1.242 0.648 0.522
Cetyl trimethylammonium chloride 6.326 0.172 0.027
*IL-1a and IL-8 above the threshold of 3 given from the frequency distribution are given in
bold characters. Table reproduced from Lemery et al.73