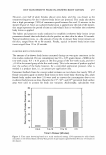
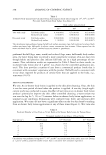
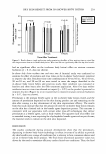
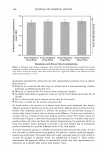
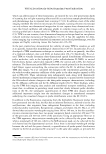
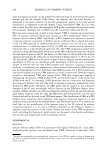
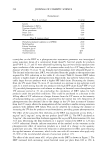
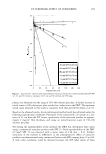
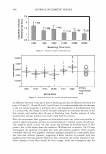
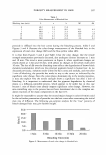
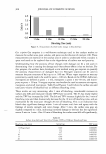
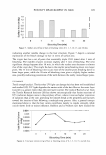
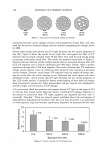
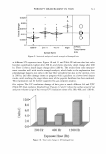
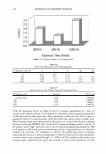
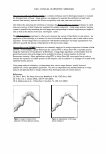
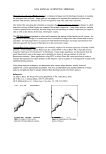
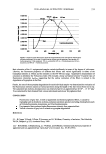
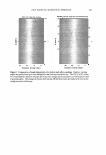
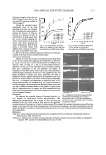
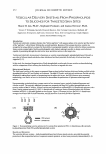
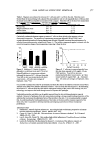
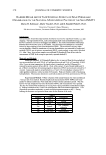
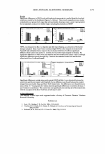
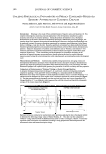
2008 ANNUAL SCIENTIFIC SEMINAR 357 Hematoxylin and eo in Cll. �El stainin& is a common technique used in histological analysis to examine the biological state of tissue. Image analysis was employed to separate the contribution of each stain, monitor stain intensity, measure the 2D area occupied by each stain, and count cell nuclei. One method for analyzing skin whitening or tanning is the Fontana-Masson stainine technique in which transverse sections of skin biopsies are examined for melanin expression. Using image analysis, me1anin content is quantified by measuring the total image area corresponding to melanin expression per length of skin as well as the density of the stain. See Figures 1 and 2. The Oil Red stainine experiment is often used to measure the amount of lipid matter in cell cultures. An application of this technique is to monitor the level of stored fat in adipocytes when treated with an active ingredient. Several image filters in conjunction with threshold techniques and image segmentation were utilized to quantify the amount of lipid present in the microscopic image. Immunonuorescent stainine techniques are commonly employed to monitor expression of certain cellular proteins. As an example, a green fluorescent dye, such as FITC or Alexa Fluor 488, is typically used to image the expression of Cytochrome C in fibroblasts. Using image algorithms, we demonstrate how the green fluorescence seen in the image can be quantified in terms of area per number of cells and fluorescence intensity. Other applications, using FITC or Alexa Fluor 488, were carried out in order to measure the expression of certain proteins in skin biopsies, such as Laminin V or Collagen IV located in the epidermal-dermal junction. Using image analysis techniques, we demonstrate how various image features, usually observed qualitatively, can be appropriately quantified. This was accomplished using standard methods of image analysis and applying them to images obtained from histological and cell culture analysis. References: [1] John C. Russ, The Image Processing Handbook, 4th Ed., CRC Press, 2002. [2] Y. Hu et al., J. lmmun. Meth,, 290: 93-105 (2005). [3] K. Matkowskyj et al., J. Histochem. Cytochem., 51: 205-214 (2003). Figure 1. Image of a skin section subjected to Fontana Masson staining. Figure 2. Segmentation of the image shown in Figure 1.

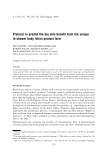
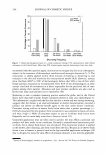
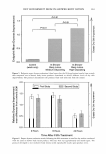
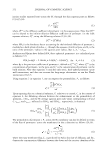
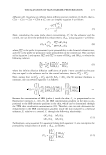
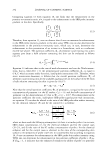
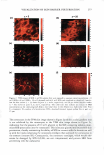
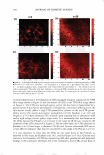
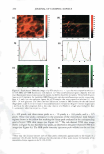
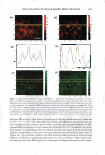
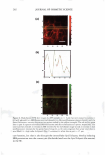
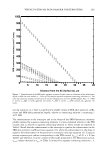
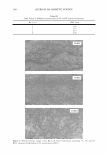
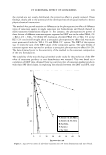
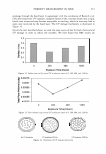
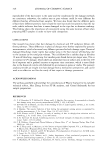
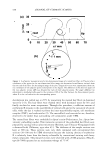
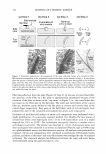
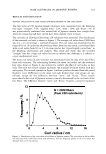
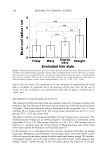
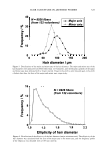
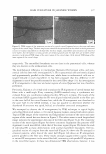
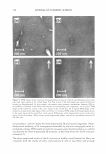
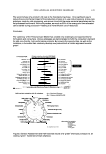
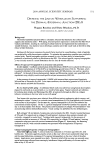
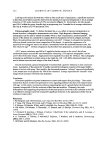
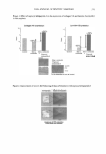
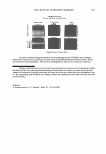
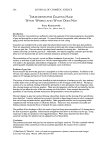
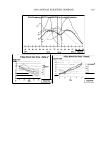
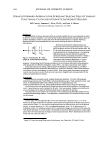
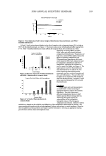
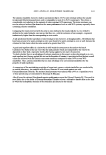
2008 ANNUAL SCIENTIFIC SEMINAR 357 Hematoxylin and eosin (H&E) staining is a common technique used in histological analysis to examine the biological state of tissue. Image analysis was employed to separate the contribution of each stain, monitor stain intensity, measure the 2D area occupied by each stain, and count cell nuclei. One method for analyzing skin whitening or tanning is the Fontana-Masson staining technique in which transverse sections of skin biopsies are examined for melanin expression. Using image analysis, melanin content is quantified by measuring the total image area corresponding to melanin expression per length of skin as well as the density of the stain. See Figures 1 and 2. The Oil Red staining experiment is often used to measure the amount of lipid matter in cell cultures. An application of this technique is to monitor the level of stored fat in adipocytes when treated with an active ingredient. Several image filters in conjunction with threshold techniques and image segmentation were utilized to quantify the amount of lipid present in the microscopic image. Imrnunofluorescent staining techniques are commonly employed to monitor expression of certain cellular proteins. As an example, a green fluorescent dye, such as FITC or Alexa Fluor 488, is typically used to image the expression of Cytochrome C in fibroblasts. Using image algorithms, we demonstrate how the green fluorescence seen in the image can be quantified in terms of area per number of cells and fluorescence intensity. Other applications, using FITC or Alexa Fluor 488, were carried out in order to measure the expression of certain proteins in skin biopsies, such as Laminin V or Collagen IV located in the epidermal-dermal junction. Using image analysis techniques, we demonstrate how various image features, usually observed qualitatively, can be appropriately quantified. This was accomplished using standard methods of image analysis and applying them to images obtained from histological and cell culture analysis. References: [1] John C. Russ, The Image Processing Handbook, 4111 Ed., CRC Press, 2002. [2] Y. Hu et al., J. Immun. Meth,, 290: 93-105 (2005). [3] K. Matkowskyj et al., J. Histochem. Cytochem., 51: 205-214 (2003). Figure 1. Image of a skin section subjected to Fontana Masson staining. Figure 2. Segmentation of the image shown in Figure 1.
Purchased for the exclusive use of nofirst nolast (unknown)
From: SCC Media Library & Resource Center (library.scconline.org)