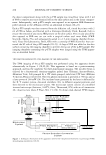
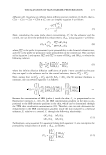
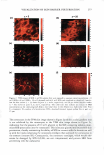
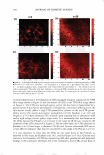
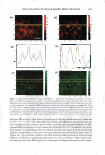
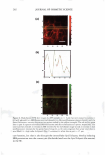
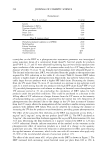
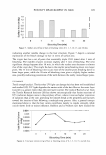
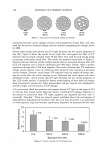
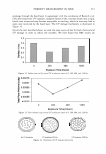
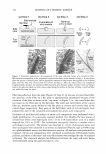
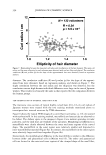
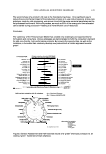
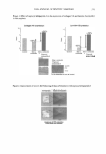
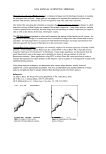
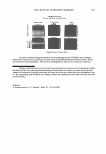
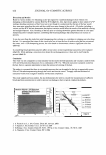
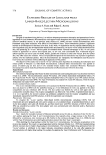
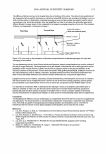
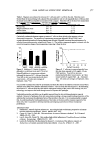
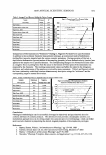
VISUALIZATION OF SKIN BARRIER PERTURBATION 283 In Figure 4e, the autofluorescence spectrum (green line) of the p-FTS sample exposed to solution ii (1 wt% SDS + 10 wt% glycerol) exhibits two major peaks, at x = 50 pixels and x = 145 pixels, and three minor peaks at x = 1 pixel, x = 73 pixels, and x = 254 pixels. These five peaks again correspond to the positions of the intercellular lipid bilayer regions (see above). The SRB probe intensity spectrum peak heights (see the red line in Figure 4e) are almost identical to those corresponding to the skin autofluorescence peaks (see the green line in Figure 4e). This indicates that contacting solution ii does not induce any significant SRB penetration into the lipid bilayers of the SC. The peak widths corresponding to the peaks at x = 1 pixel and x = 145 pixels are larger for the SRB probe fluorescence intensity spectrum (the red line in Figure 4e) relative to the skin autofluo rescence intensity spectrum (the green line in Figure 4e). This indicates penetration of the SRB probe into these regions, which are, in fact, the corneocyte regions of the SC. Therefore, these TPM results indicate that adding 10 wt% glycerol to an aqueous 1 wt% SDS contacting solution mitigates SDS-induced intercellular lipid bilayer disruption, but does not eliminate SDS-induced SRB penetration into the corneocyte regions of the SC. In Figure 56, the autofluorescence spectrum (green line) of the p-FTS sample exposed to solution iii (1 wt% SCI) exhibits two major peaks, at x = 1 pixel and x = 107 pixels, and three minor peaks at x = 57 pixels, x = 158 pixels, and x = 210 pixels. These five peaks again correspond to the positions of the intercellular lipid bilayer regions (see above). The SRB probe intensity spectrum peak heights (see the red line in Figure 56) are higher than those corresponding to the skin autofluorescence peaks (see the green line in Figure 56). This indicates that contacting solution iii promotes SRB penetration into the intercellular lipid bilayers of the SC. However, upon comparing Figure 5a-c with Figure 4a-c, which correspond to 1 wt% SDS, it is clear that 1 wt% SCI induces a lower SRB penetration into the intercellular lipid bilayers relative to 1 wt% SDS. 11 This finding is consistent with transmission electron microscopy (TEM) studies on the effect of SCI on the skin barrier reported by Ananthapadmanabhan et al. (6,43). Specifically, these authors found that SCI does not induce skin dryness relative to SDS, because SCI disorders the intercellular lipid bilayer structure in the SC to a lesser extent than SDS (6,43,45). The SRB probe intensity spectrum peak widths (see the red line in Figure 56) are slightly larger than the skin autofluorescence intensity spectrum peak widths (see the green line in Figure 56). This difference between the SRB probe fluorescence and the skin autofluorescence intensity peak widths provides evidence of SCI-induced SRB penetration into the corneocytes, albeit to a lesser extent than that induced by SDS (see above). 12 In Figure 5e, the peaks corresponding to the skin autofluorescence intensity spectrum are lower in height than those corresponding to the SRB probe fluorescence intensity spectrum. This indicates that when p-FTS samples are exposed to the PBS control 11 Comparing Figure 4d-f with Figure Sa-c, one can also observe that contacting solution iii containing 1 wt% SCI promotes a lesser extent of SRB penetration into the intercellular lipid bilayers relative to contacting solution ii containing 1 wt% SDS + 10 wt% glycerol. 1 2 Indeed, SDS induces a larger difference in the SRB fluorescence and skin autofluorescence peak widths than SCI (compare Figures 46 and Sb). This is because SDS, being a harsh surfactant, interacts more strongly with the corneocyte envelopes and corneocyte keratins than SCI, which is a mild surfactant (6,43,45).

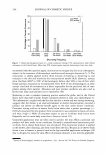
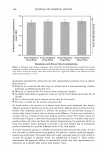
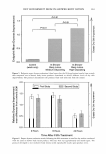
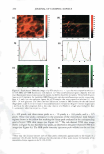
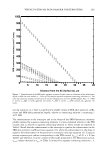
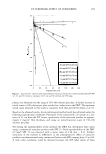
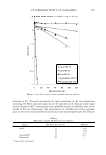
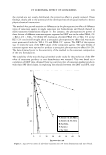
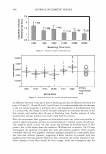
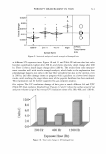
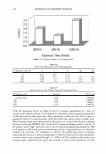
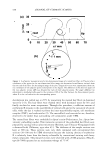
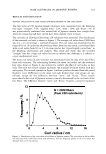
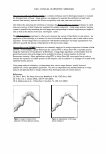
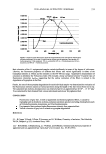
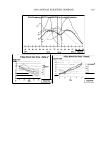
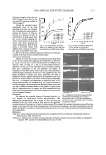
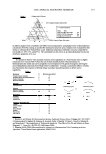
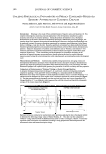
284 JOURNAL OF COSMETIC SCIENCE solution (contacting solution iv), followed by exposure to the SRB probe solution, SRB is located within the intercellular lipid bilayers. The peak widths corresponding to the red and green channels in Figure Se are very similar, thereby showing that very little SRB probe is present in the corneocyte regions of the SC. In Figure 66, the intensity spectrum peaks corresponding to the skin autofluorescence are almost identical to those corresponding to the SRB probe fluorescence intensity spectrum, including the peak positions, widths, and heights. This indicates that very little SRB probe is present in the intercellular lipid bilayer region of the SC. In addition, the widths of the peaks corresponding to the red-channel (SRB probe fluorescence) intensity are similar to those corresponding to the green-channel (skin autofluorescence) intensity. Therefore, very little SRB probe is present in the corneocyte region of the SC. Indeed, when p-FTS samples are exposed to solution v (10 wt% glycerol), glycerol reduces the average pore radii and the porosity-to-tortuosity ratio of the aqueous pores in the SC (2) through which hydrophilic permeants like SRB penetrate into the SC. As a result, p-FTS samples that were exposed to solution v containing 10 wt% glycerol, and subsequently exposed to the SRB contacting solution, show very little SRB penetration into the SC. Therefore, SRB is not present in any significant amount either in the intercellular lipid bilayer region or in the corneocyte region of the SC. ANALYSIS OF THE AQUEOUS PORE PATHWAY CHARACTERISTICS USING SRB INTENSITY PROFILES AS A FUNCTION OF SC DEPTH IN THE CONTEXT OF A HINDERED-TRANSPORT MODEL The five SRB fluorescence intensity profiles corresponding to solutions i - are plotted as a function of the skin barrier depth (z) in Figure 7. One can clearly see that the SRB fluorescence intensity count induced at the SC surface (z = O) by aqueous contacting solutions i-v follows the order (from the highest to the lowest): i ii iii iv v. Specifically, for all these five contacting solutions, the aqueous contacting solution with 1 wt% SDS induces the highest SRB-skin partition coefficient. 13 Interestingly, the SRB-skin partition coefficient induced by the 1 wt% SDS aqueous contacting solution is significantly reduced, by more than three times, when 10 wt% glycerol is added to the solution (see Figure 7 and Table I). This provides additional evidence that glycerol mitigates the ability of SDS to interact strongly with the SC surface, thereby reducing skin permeability. In addition, the 1 wt% SDS aqueous contacting solution induces significantly deeper penetration of SRB into the skin relative to aqueous contacting solutions ii-v (see Figure 7). Note that a similar observation was made when comparing the color scale bars associated with Figure 26 to those associated with Figure 2d,f and with Figure 36,d (see above). Therefore, adding 10 wt% glycerol to a 1 wt% aqueous SDS contacting solution not only reduces the SRB-skin partition coefficient, but also reduces the depth to which SDS can drive SRB into the skin. Both of these findings provide evidence of the ability of the humectant, glycerol, to mitigate SDS-induced skin barrier perturbation. Aqueous con- 13 Note that the SRB-skin partition coefficient between the donor contacting solution and the skin, q:, is proportional to the SRB fluorescence intensity count induced at the SC surface (z = 0) (see the Theoretical section).
Purchased for the exclusive use of nofirst nolast (unknown)
From: SCC Media Library & Resource Center (library.scconline.org)