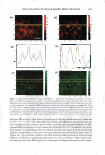
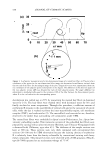
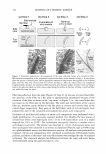
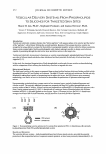
VISUALIZATION OF SKIN BARRIER PERTURBATION 265 which can address some of these limitations, are limited by: (a) a low penetration depth of scanning due to light-scattering effects and (b) accrued tissue sample photobleaching and photodamage due to repeated laser scanning (17, 18). In addition, most of the other imaging methods like electron microscopy (for example, scanning electron microscopy) can only achieve two-dimensional images that do not capture three-dimensional struc tures like blood capillaries and sebaceous glands in complex tissues such as the kera tinizing epithelium in human skin (19). TPM has overcome these diagnostic limitations (19). TPM is a non-invasive, three-dimensional imaging technique based on two-photon induced nonlinear excitations of fluorophores (16-19). It has the capability for deep tissue imaging (up to several hundred micrometers) and reduced photodamage, even for opaque and highly scattering tissues like human skin (16-20). In the past, studies have demonstrated the viability of using TPM to visualize, as well as to quantify, human skin morphological characteristics (20-23). In particular, Yu et al. developed a TPM visualization technique to visualize, as well as to quantify, the effect of a chemical enhancer, oleic acid (QA), on human skin (20-23). Specifically, Yu et al. used TPM to visually determine three-dimensional spatial distributions of fluorescent probe molecules, such as the hydrophilic probe sulforhodamine B (SRB), in excised full-thickness human cadaver skin exposed to PBS, the control, and to OA, the chemical enhancer. The fluorescent probe SRB was observed to reside primarily in the intercellular lipid bilayer region surrounding the corneocytes within the SC. In addition, from the TPM skin images, Yu et al. calculated the changes in the concentration gradient and in the vehicle-to-skin partition coefficient of the probe in the skin samples exposed to OA and to PBS (20). These calculations were subsequently used, along with theoretically derived mathematical expressions of transdermal transport, to quantitatively characterize the QA-induced relative changes to the skin-probe transport characteristics, including the SC diffusion coefficient and the SC diffusion length (20,23). These findings, utiliz ing the TPM skin imaging data analysis and transdermal transport modeling, demon strate that, in addition to providing visual scans that clearly delineate probe distribu tions in the SC, the subsequent quantification of these TPM skin images provides additional important insight into the mechanistic changes in transdermal transport underlying the visualized changes in probe distributions across the SC (20,23). In addition to the fluorescence originating from the hydrophilic fluorescent probes that have penetrated into the skin, the skin has an inherent florescence, referred to as the skin autofluorescence, that originates from endogenous fluorophores in the skin, including reduced pyridine nucleotides, flavoproteins, collagen, and elastin (24,25). Na et al. (25) showed that excitation wavelengths ranging from 340 to 380 nm, in the skin autofluo rescence emission spectrum, have two major component bands centered at 450 nm (75% of the spectrum) and 520 nm (25% of the spectrum). Using an appropriate filter set in the TPM apparatus, these emission wavelengths can be collected by the green channel, while a wavelength of 5 86 nm, which is the SRB emission peak, can be collected by the red channel (see the Experimental section). Since there is minimal wavelength overlap between the red and the green channels, a quantification of probe spatial distributions relative to the brick-and-mortar SC structure3 in the same skin sample, at precisely the 3 The stratum corneum (SC) has a brick-and-mortar structure, with the corneocytes as the bricks and the intercellular lipid bilayers as the mortar (44).

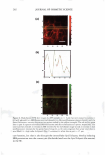
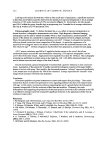
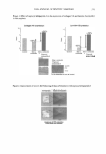
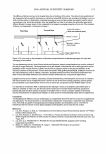
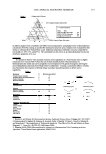
266 JOURNAL OF COSMETIC SCIENCE same skin spatial locations, can be achieved by this technique of dual-channel (the green channel and the red channel) TPM. Hence, the inherent skin structural features, as delineated in the green channel, can provide a fingerprint relative to the probe spatial distribution, as delineated in the red channel. Using dual-channel TPM, Yu et al. were able to show that OA drove the hydrophilic SRB probe to preferentially partition across the corneocyte envelopes and to diffuse into the corneocytes within the SC (21). We have used conventional, as well as dual-channel, TPM to visualize and quantify the effect of aqueous surfactant-humectant systems on p-FTS morphology4 relative to an aqueous control solution (PBS). Specifically, p-FTS samples were exposed to aqueous contacting solutions containing: (i) SOS (an anionic surfactant that is a harsh skin agent (2-6) (ii) SDS+glycerol (a surfactant/humectant mixture (2)) (iii) SCI (an anionic surfactant that is a mild skin agent (6,45)) (iv) PBS (the control) and (v) glycerol (a humectant that is a skin beneficial agent (10-15)). The TPM visualization studies were carried out using the hydrophilic fluorescent probe SRB, which penetrates into the skin through aqueous pores in the SC and hence, can shed light on the modification of these aqueous pores induced by surfactants in the presence of humectants (2-6, 20-23, 31-35, 38). Specifically, SRB emits a fluorescent signal in the red channel, has an emission peak wavelength of 586 nm, an absorbance peak wavelength of 565 nm, and a molecular weight of 559 Da (20-23). The p-FTS samples were exposed to aqueous contacting solutions i-v separately and, subsequently, were contacted with aqueous SRB solutions (see the Experimental section). Following these SRB exposures, the p-FTS samples were dried and visualized using the TPM apparatus to obtain conventional TPM skin images, as well as dual-channel TPM skin images. These TPM skin images were capable of determining the location of SDS within the SC, as well as the nature of the interactions of SOS with the SC. For example, if SDS penetrates into the corneocytes and denatures the corneocyte keratins, this will then result in increased corneocyte permeability to the fluorescent SRB probe. Therefore, the SRB probe will be located in the corneocyte domains of the SC and, accordingly, will be detected in the TPM skin images. Alter natively, if SDS penetrates into the intercellular lipid bilayers of the SC and disorders the lipid bilayer domains of the SC, then the SRB probe will also penetrate into the lipid bilayers and will be detected in the TPM skin images. The distribution of SRB in p-FTS samples upon contacting them separately with aqueous contacting solutions i-v was analyzed using a theoretical model presented in the Theoretical section. This analysis can shed light on the modification of the aqueous pores in the SC induced by aqueous contacting solutions i, ii, iii, and v, referred to hereafter as the enhancer, relative to aqueous contacting solution iv, the control. Finally, the results of the TPM visualization study, including the theoretical model results, are discussed in the Results and Discus sion section and summarized in the Conclusions section. EXPERIMENT AL MATERIALS Sodium dodecyl sulfate (SDS) was purchased from Sigma Chemicals (St. Louis, MO). Analytical-grade glycerol was purchased from VWR Chemicals (Cambridge, MA). 1 Because the permeability and morphological characteristics of p-FTS are similar to those of human skin, pig skin is an excellent model for human skin for both in vitro and in vivo skin permeability and imaging studies (26,46).
Purchased for the exclusive use of nofirst nolast (unknown)
From: SCC Media Library & Resource Center (library.scconline.org)