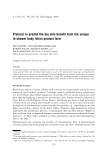
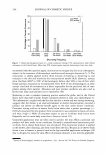
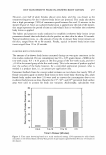
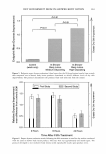
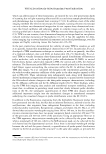
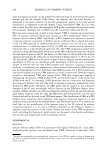
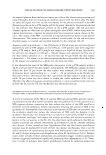
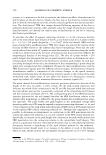
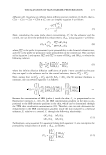
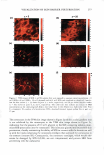
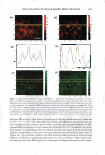
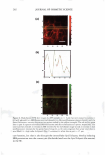
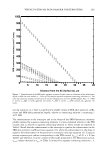
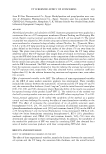
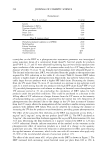
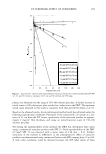
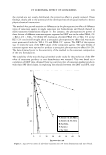
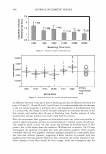
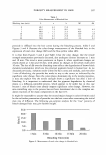
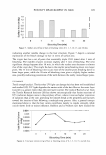
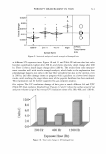
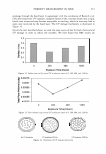
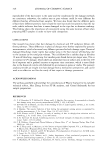
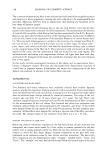
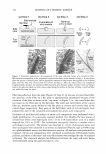
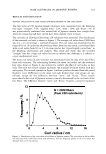
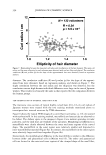
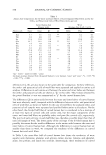
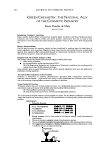
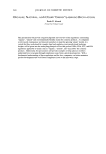
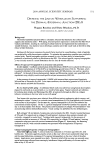
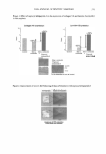
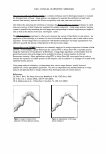
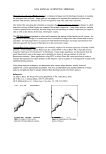
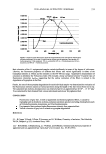
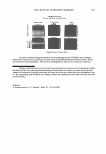
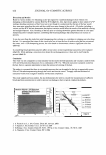
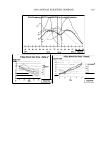
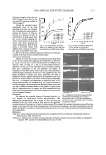
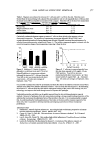
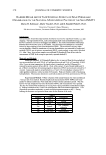
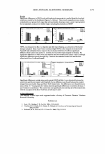
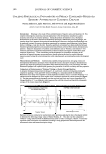
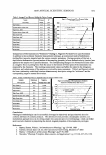
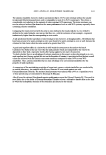
312 3.0 2.5 � 2.0 � 1.5 0. 1.0 0.5 0.0 UV Exposure time (hr) 0 200 400 1200 JOURNAL OF COSMETIC SCIENCE 200Hr 400Hr 1200 Hr Exposure Time (Hour) Figure 11. Lightness change in UV-damaged hair. Table III Hair Color Measurement of UV-Damaged Hair L a b b.E 39.22 6.45 16.73 41.09 6.72 17.87 5.72 42.08 7.14 19.75 3.54 44.85 7.20 21.96 8.61 Table IV Surface Area and Pore Volume Versus UV Irradiation Times UV Exposure (hr) 0 (Virgin hair) 200 400 1200 0.40 0.22 0.30 0.34 b.L 1.87 0.99 2.78 TPV (cc/g) 0.000689 0.000581 0.000651 0.000729 � ith the bleaching shown in Table II, the SA increases significantly at 1 min. In contrast, after the first 200 hr of UV irradiation, the surface area decreases by almost half of that detected for the virgin hair. This proves that within the first 200 hr there is significant fusion of certain portions of the hair fiber that causes a loss in surface area. These findings agree with those found by Reutsch et al. using field emission scanning electron microscopy (FESEM) (20), in which UV irradiation damage leads to "fusion" of the surface cuticle edges. However, this is nor the only thing happening during first 200 hr of exposure. Additional pores are also formed, which is supported by a loss of tensile strength. At continue I UV irradiation to 400 hr, the surface area starts to increase, indicating that more ne,· pores are generated or that the fused layer has been perforated to some extent to let nitrogen through .. At 1200 hr of UV irradiation, the surface area increases again, indicating once again the increase in pores or the generation of more

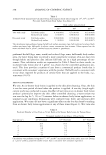
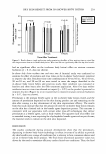
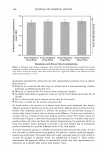
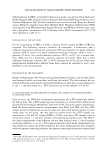
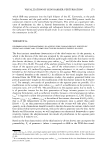
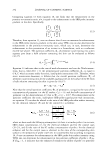
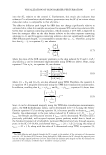
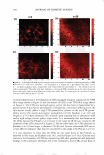
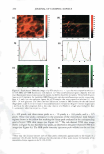
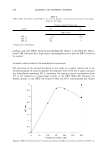
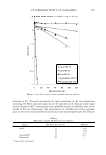
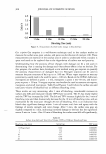
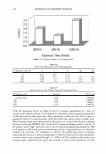
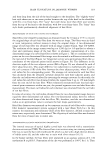
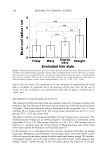
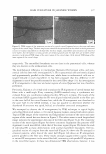
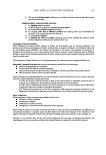
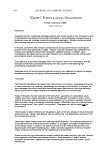
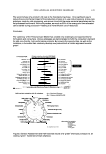
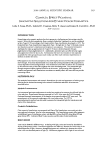
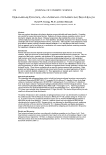
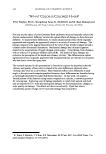
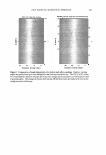
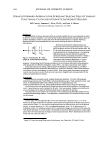
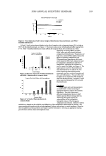
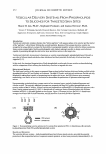
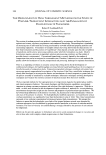
POROSITY MEASUREMENT IN HAIR 313 openings through the fused layer. In agreement , ith the conclusions of Reutsch et al. (20), after long-term UV exposure, complete fusion of the cuticular sheath into a rigid, brittle unit occurs and may become susceptible to cracking, which in turn may lead to pores once restricted by the fused layer. The UV damage mechanism is illustrated in Figure 14. For all the tests described above, we used the same source of hair for both chemical and UV damage in order to reduce the variables. We have found that BET results are 0.5 "' 0.4 0.3 0.2 - 0.1 - 0 0 200 400 1200 Exposure Time (hours) Figure 12. Surface area (m2/g) versus UV irradiation times of 0, 200, 400, and 1200 hr. ii 0.00075 .!!. 0.0007 § 0.00065 0.0006 l, 0.00055 I t- 0 200 400 1200 Exposure Time (Hours) Figure 13. Pore volume (cc/g) versus UV irradiation times of 0, 200, 400, and 1200 hr. No UV Irradiation UV Irradiation 200 Hrs UV Irradiation 1200 Hrs Figure 14. Illustration of UV damage mechanism.
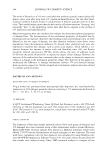
Purchased for the exclusive use of nofirst nolast (unknown)
From: SCC Media Library & Resource Center (library.scconline.org)