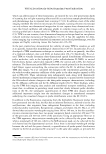
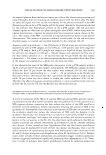
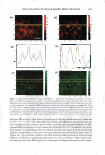
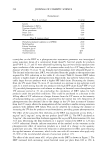
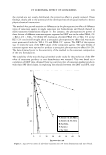
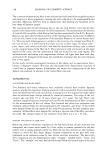
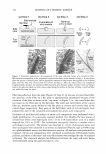
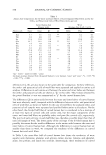
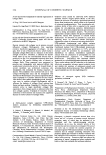
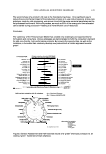
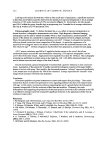
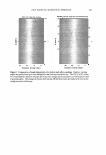
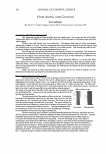
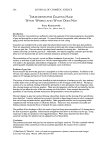
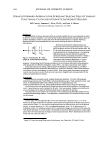
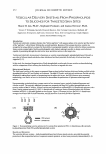
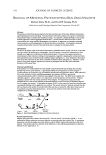
VISUALIZATION OF SKIN BARRIER PERTURBATION 269 the emitted photons from the laser excitation are collected by the microscope system and passed through a filter set consisting of a dichroic mirror with two filters (20). The filter set splits the signal into two: (a) the red channel for the photons emitted by the SRB fluorescent probe in the p-FTS sample and (b) the green channel for the photons emitted by the intrinsic skin fluorophores present in the p-FTS sample. The red and green channel signals are then sent to a photo multiplier tube (PMT), which along with the photon discriminator, comprise the photon detection-conversion system, shown in Fig ure 1. The output of the PMT is converted to single photoelectron pulses via the photon discriminator. The number of photons collected at each pixel, for the red and green channel images, is counted and recorded digitally by the computer (24,30). Aqueous contacting solutions i - (see Preparation of the Solutions section) were exposed separately to seven p-FTS samples, and six 100-µm x 100-µm skin sites were imaged for each p-FTS sample. Each p-FTS sample was imaged to a depth of 40 µm. Specifically, for each skin site imaged, 41 100-µm x 100-µm images were obtained, the first one at the skin surface (denoted as z = 0) and the last one 40 µm below the skin surface (denoted as z = 40), where z is the direction perpendicular to the surface of the skin. Each of the images was separated by a depth of 1 µm from the other. It was observed that most of the SRB probe was present in the p-FTS samples within a depth of 20 µm below the skin surface. Consequently, the TPM skin images obtained within the first 20 µm below the skin surface were analyzed (20-23), and images obtained at layers corresponding to z = 3 and z = 20 are presented in the Results and Discussion section. One should note that 3 µm below the skin· surface is within the SC, while 20 µm below the skin surface is within the viable epidermis (VE) (39,44). Therefore, the effects of aqueous contacting solutions i-v were visualized on the structure of both the SC and the VE (see the Results and Discussion section). DETERMINATION OF SC MORPHOLOGICAL CHANGES INDUCED BY SURFACTANT-HUMECTANT SYSTEMS USING A DECONSTRUCTION ANALYSIS OF THE DUAL-CHANNEL TPM IMAGES A recent investigation of the effects of aqueous SDS and aqueous SDS+glycerol contact ing solutions on the skin barrier has shown that the addition of 10 wt% glycerol to an SDS aqueous solution contacting the skin reduces the ability of the SDS micelles to penetrate into the epidermis, thereby significantly reducing the amount of SDS in the epidermis (2). Presumably, this reduction in the amount of SDS that can penetrate into the epidermis should also reduce the interactions of SDS with the keratins in the epidermis. Specifically, this should result in a reduction in the ability of SDS to rupture the corneocyte envelopes, and expose and disrupt secondary and tertiary structures of keratin in the corneocytes in the SC. On the other hand, mild surfactants like SCI are known to perturb the ordered intercellular lipid bilayers in the SC, thereby inducing skin dryness. In fact, researchers have hypothesized that the skin barrier perturbation response may be modulated by both of these two distinct mechanisms, that is: (a) the direct interaction of a penetrating skin agent with the keratins in the corneocytes in the SC and (b) bilayer disruption and delipidization of the SC lipid bilyers (5,6,9). Further more, either or both of these mechanisms can potentially trigger cytokine production, thereby triggering biochemical signals and promoting skin inflammation (5,9). There fore, in order to mitigate skin barrier perturbation induced by surfactant-humectant

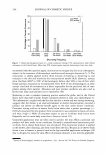
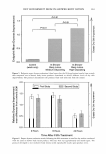
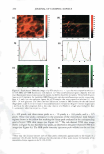
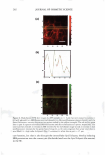
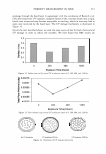
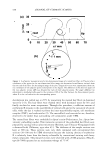
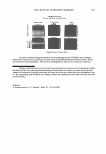
270 JOURNAL OF COSMETIC SCIENCE systems, it is important to be able to minimize the deleterious effects of mechanisms (a) and (6) above on the skin barrier. Clearly, the first step in this direction involves being able to identify if mechanism (a) or (b), or both, induces significant skin barrier perturba tion. The dual-channel TPM skin images obtained following exposure of the skin to surfactant-humectant systems, when analyzed using the image deconstruction analysis described below, can identify the relative roles of mechanisms (a) and (b) in inducing skin barrier perturbation. To elucidate the effect of aqueous contacting solutions i-v on the corneocyte keratins and on the intercellular lipid bilayers of the SC, a two-dimensional slice, 5 pixels (width) [y = 1 to 5} x 256 pixels (length) [x = 1 to 256},6 of the red-channel (SRB) and the green-channel (skin autofluorescence) TPM skin images was selected for analysis of the location of SRB relative to the inherent skin barrier morphology. Note that the arbi trarily .selected line width of 5 pixels accounts for intensity variations along the width of the slice, while limiting the inclusion of intensities that may result from different SC morphological features in the average value (21). The slice of 5 pixels (width) x 256 pixels (length) was deconstructed into its pixel intensity values to determine the inter cellular region width, defined by the fluorescence intensity peak widths. At each posi tion along the length of this slice, the intensities of the corresponding 5 pixels along the width were averaged and then normalized. Because the skin autofluorescence and the SRB fluorescence signals span two different intensity ranges, the fluorescence intensity normalization enables a comparison of the relative changes in the spatial intensity distributions between these two fluorescence intensity signals in the context of the same normalized scale, where values of zero reflect the absence of a fluorescence intensity signal and values of 1 reflect maximum fluorescence intensity signals (21). The green-channel skin autofluorescence intensity spectrum, plotted as a function of the length of the slice (in pixels, 1-256), reveals: (A) the peak-to-peak separation that indicates the width of the corneocytes in the SC and (B) the peak width that indicates the intercellular spacing that is essentially comprised of the intercellular lipid bilayers and the corneocyte envelopes (20-23). The corresponding plot of the SRB fluorescence intensity spectrum for the red channel describes the SRB distribution relative to the inherent skin morphology, as defined by the green-channel skin autofluorescence inten sity spectrum. The peak widths and peak heights in the normalized average SRB intensity profiles in p-FTS samples exposed to aqueous contacting solutions i, ii, iii, and v were compared to the peak width and peak height of SRB in the p-FTS sample exposed to the aqueous PBS control contacting solution (iv). Through this comparison, it was possible to determine an enhancement, or a reduction, in the SRB penetration into the corneocytes induced by solutions i, ii, iii, and v relative to the PBS control solution (iv). Specifically, an increase in the peak height and a decrease in the peak width indicate less SRB penetration into the corneocytes relative to the intercellular lipid bilayers. This serves as a qualitative indicator of mechanism (b) above, that is, intercellular lipid bilayer disruption, because a disordering of the lipid bilayers induced by the surfactant humectant system should result in an increase in the defects or voids in the bilayers, which in turn, should increase the size/number of aqueous pores (2,31-34,45) through 6 Note that in the TPM skin images, 256 pixels corresponds to 100 µm in dimension therefore, a 100-µm x 100-µm image is actually a collection of 256 x 256 = 65536 pixels.
Purchased for the exclusive use of nofirst nolast (unknown)
From: SCC Media Library & Resource Center (library.scconline.org)