466 JOURNAL OF COSMETIC SCIENCE
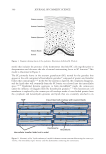
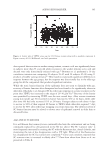
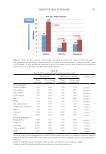
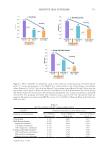
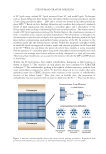
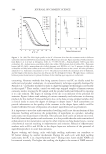
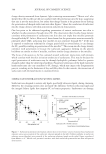
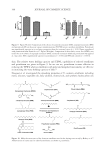
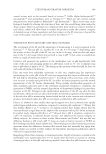
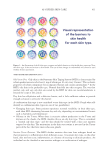
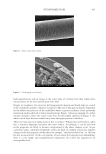
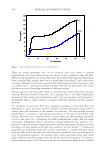
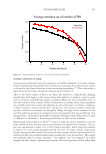
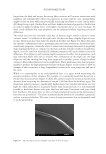
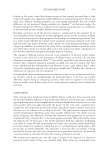
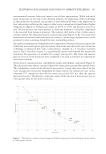
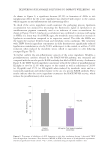
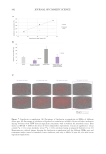
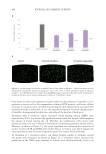
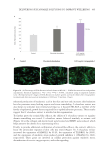
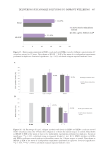
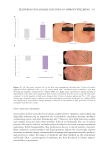
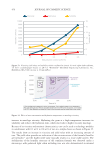
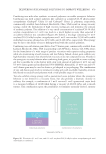
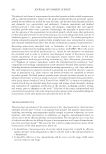
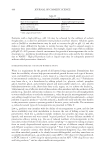
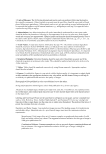
Figure 11. (A) Percentage of collagen gel contraction shown as MEAN ± SEM of the mean of eight
independent experiments. Statistical significance: ***p 0.001, calculated using an unpaired student’s
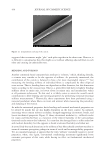
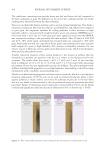
t-test. (B) Representative images showing collagen gel contraction after tetrapeptide-1 treatment and after
microcurrent stimulation (1000 µA, 70 mv/mm, 1 hour).
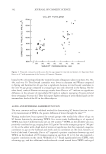
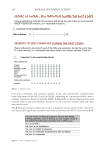
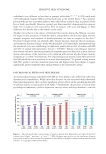
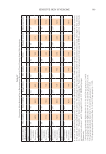
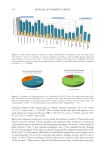
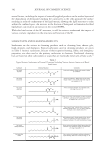
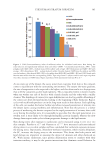
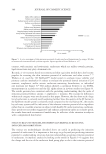
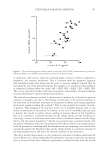
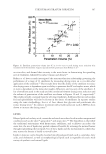
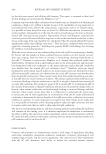
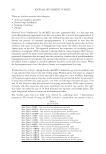
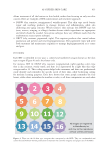
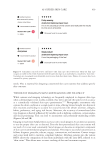
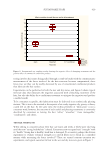
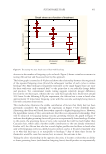
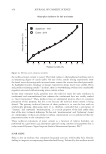
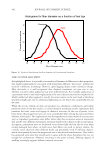
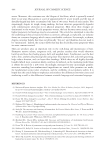
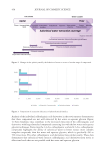
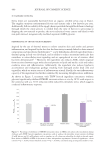
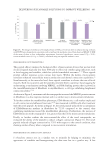
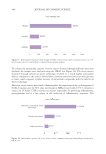
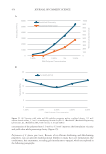
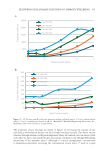
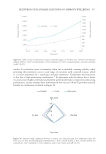
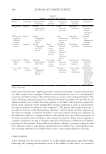
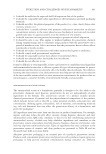
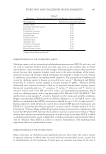
Figure 12. Relative gene expression in HDFa cocultured with HEKa treated at different concentrations of S
rebaudiana extract for 24 hours. Data shown as MEAN ± SEM of the mean of six independent experiments
performed in duplicates. Statistical significance: *p 0.05, calculated using an unpaired student’s t test.
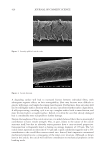
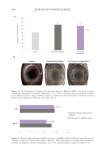
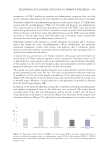
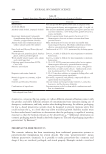
Figure 11. (A) Percentage of collagen gel contraction shown as MEAN ± SEM of the mean of eight
independent experiments. Statistical significance: ***p 0.001, calculated using an unpaired student’s
t-test. (B) Representative images showing collagen gel contraction after tetrapeptide-1 treatment and after
microcurrent stimulation (1000 µA, 70 mv/mm, 1 hour).
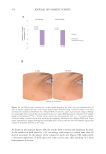
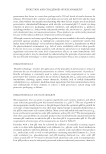
Figure 12. Relative gene expression in HDFa cocultured with HEKa treated at different concentrations of S
rebaudiana extract for 24 hours. Data shown as MEAN ± SEM of the mean of six independent experiments
performed in duplicates. Statistical significance: *p 0.05, calculated using an unpaired student’s t test.